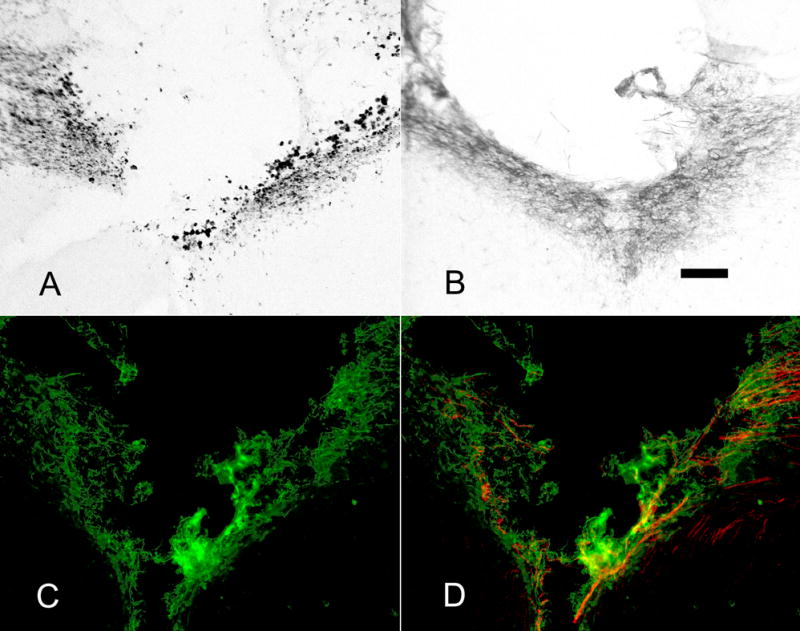
Figure 5.

ED-1, NG2 and CSPG staining around the lesion. There was no difference in ED-1, NG2 or CSPG staining between groups – sections are representative. A) A lesion at the midline of the corpus callosum induces macrophages stained with ED-1 antibody around the lesion area (NGF pathway). B) NG2 expressing cells also presented around the lesion after injury (NGF pathway). C) CSPGs were up-regulated around the lesion area. D) In both NGF and FGF/NGF groups, CGRP+ axons (red) grew into CSPG (green) expressing lesion area. Sections shown in C and D are from the FGF/NGF pathway group. Scale bar = 100μm.
