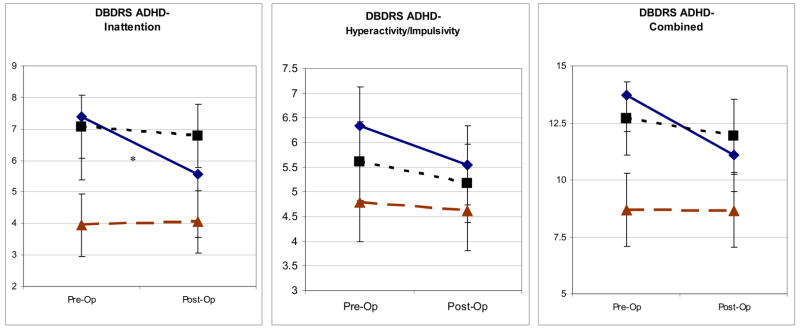
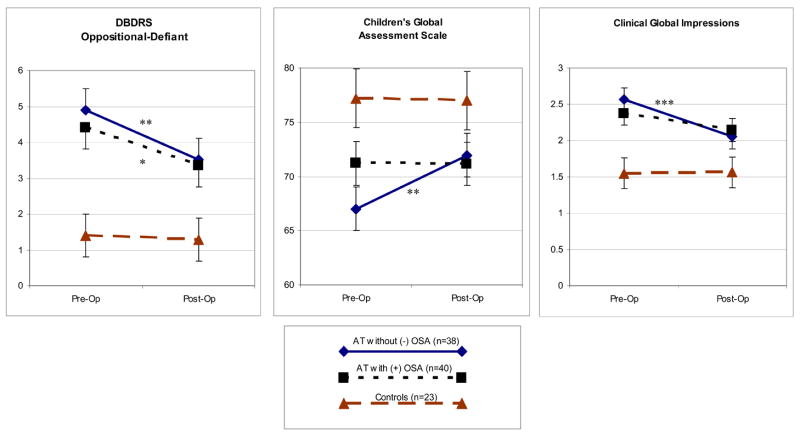
Figure 1. Psychiatric Ratings at Baseline and Follow-Up in Three Groups of Subjects.
Statistical associations shown here reflect effect slices (univariate analyses based on adjusted means, equivalent to paired student’s t-tests) showing the significance of change in subgroups of children with or without OSA from pre-op to post-op assessment. There were no significant differences between OSA subgroups at baseline or at follow-up. DBDRS = Disruptive Behavior Disorders Rating Scale.
* p < .05
** p < .01
*** p < .001


