
Fig. 7.
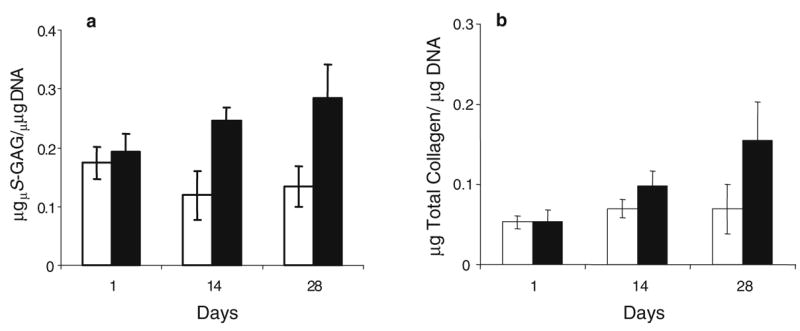
Results of biochemical assay for a S-GAG and b total collagen content per total DNA for day 1, 14 and 28 -TGF-β3 (white bar) and +TGF-β3 (black bar) constructs are depicted per total DNA content. Bars represent the mean ± standard deviation for n=3 samples.