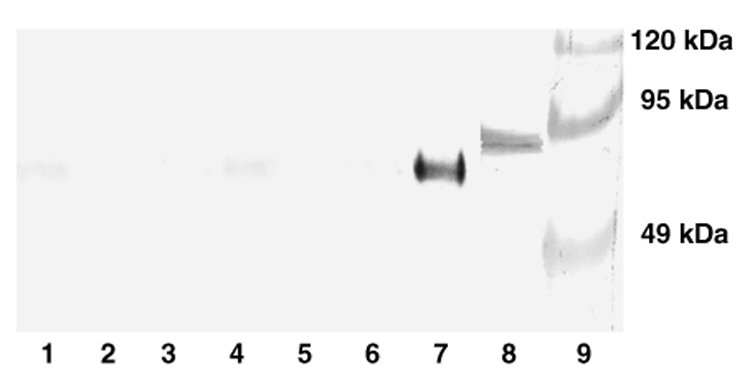
Fig. 2.

Nitrotyrosine levels in bee brain visualized by Western blot. The amount of nitrotyrosine nitration damage is low compared to positive controls. Lanes 1 and 2: diutinus bees. Lanes 3 and 4: nurse bees. Lanes 5 and 6: foragers. Lane 7: positive control; honey bee brain tissue homogenized with 31.3 mM peroxynitrite. Lane 8: positive control: 1 µg nitrated BSA from Cell Biolabs, Inc. Lane 9: Prestained molecular marker. Each sample from worker bees (lanes 1–7) contains 20 µg protein.
