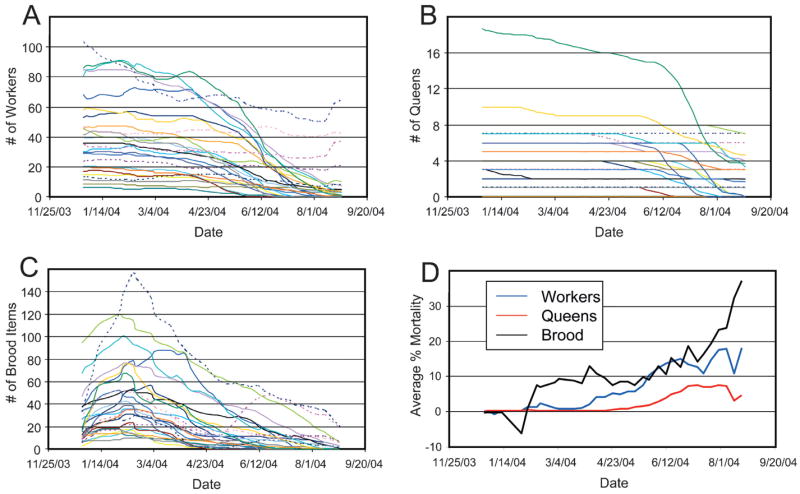
Figure 1.

The temporal change of worker (a), queen (b) and brood (c) numbers in 26 laboratory colonies of T. rugatulus over an experimental eight months starvation period. Dashed lines indicate control colonies. (d) indicates the average proportional net mortality (“deaths” – “births”) of workers, queens and brood items in all starved colonies
