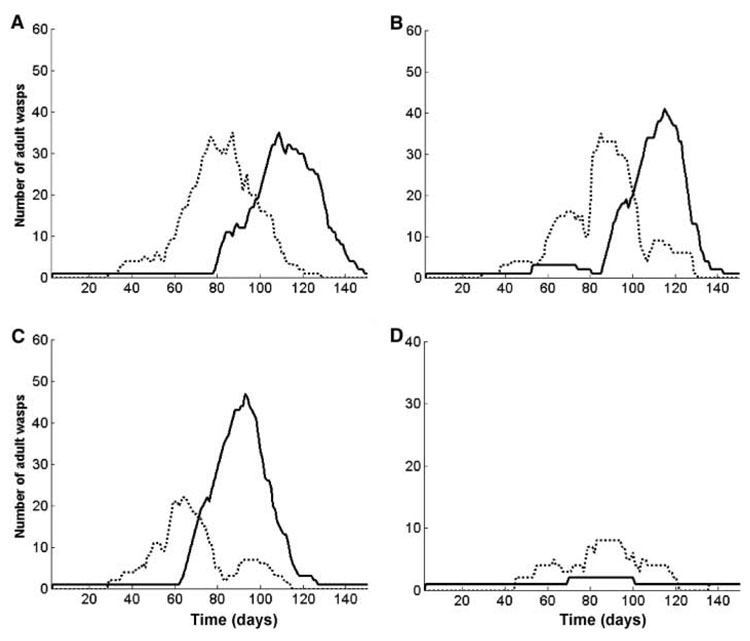
Fig. 3.
Output from four separate runs illustrates the dynamics of the individual-based model. Each simulation shows the number of workers from the G1 pathway (dotted line) and gynes of the G2 trajectory (solid line) present on a nest. The amount of food available to individuals that forage is the only variable changed between runs. (A) Moderate food levels generate a peak of workers followed by a peak of gynes. (B) Day-to-day random fluctuations in food generated by the model can result in early gynes, late workers, or both in the same run. (C) More food leads to an earlier worker peak and to earlier production of more gynes, and the food demands of those gynes cause a late peak of workers and early termination of brood rearing. (D) Very low food conditions result in few offspring, almost all of which are workers, and early termination of brood rearing.

