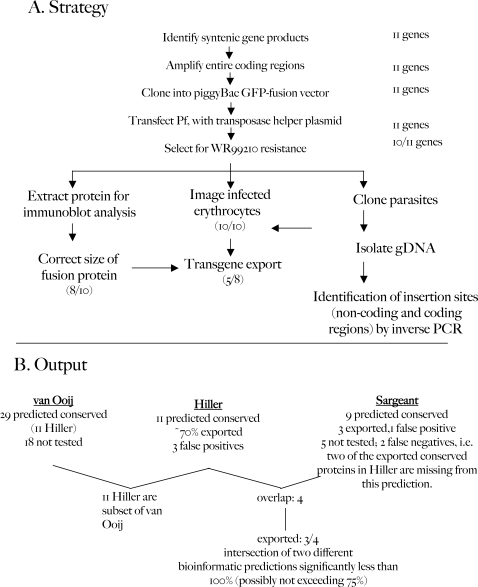
Figure 3. Outline for the validation of secretome predictions.
A) Strategy for expression and analysis of syntenic gene products. Numbers on the right-hand side and in parentheses indicate the number of genes that were positive over the number of genes tested. B) Output of data obtained from part A and corresponding analyses in context of Hiller, Sargeant and van Ooij secretomes.

