
Figure 6. Liver insulin action and hyperinsulinemic-euglycemic clamp.
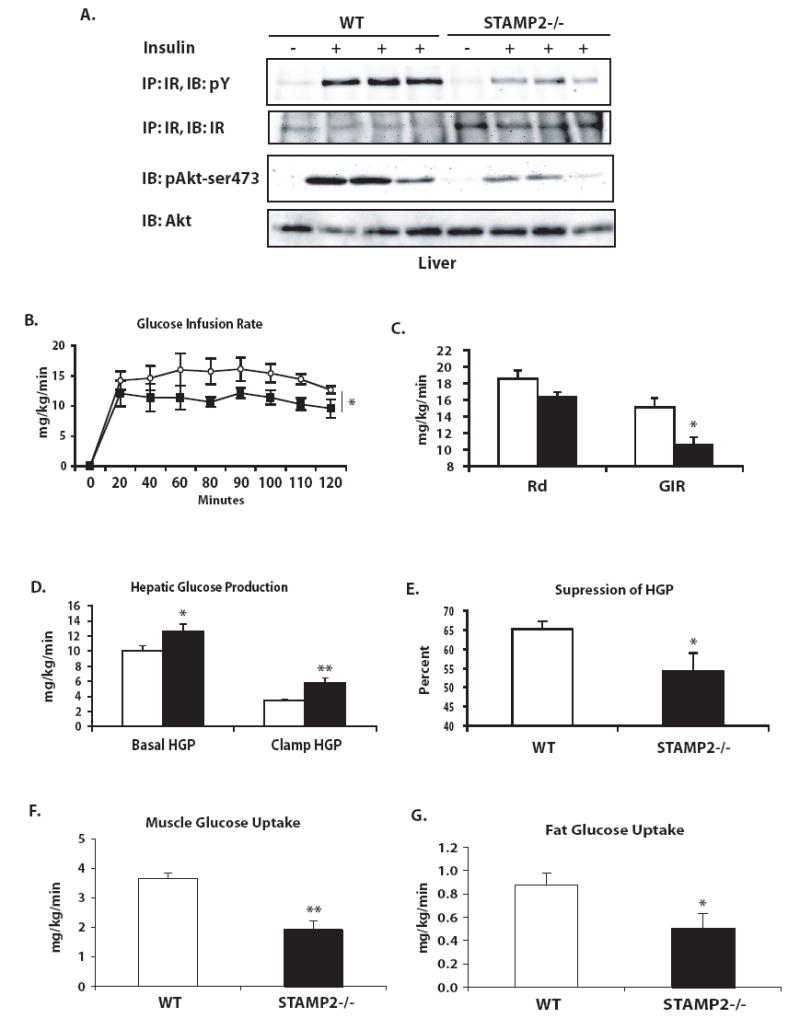
(A) Insulin action in the liver following insulin injection into the portal vein of anesthetized mice. Each lane represents one animal. (B) Hyperinsulinemic-euglycemic clamp experiments. Rate of glucose infusion was higher in wild type than in STAMP2-/- mice over the 2 h course of the clamp. (C) Average GIR and Rd were calculated. (D) Hepatic glucose production at basal and clamp conditions, as well as (E) percent suppression of hepatic glucose production by hyperinsulinemic clamp were calculated. (F) Muscle and (G) adipose tissue glucose uptake during the clamp were assessed by measuring uptake of a 14C-2-deoxyglucose tracer. * p<0.05; ** p<0.005. Data graphed as mean ± s.e.m. For parts C-G, open bars- wt; closed bars- STAMP2-/-. For part B, open circles- wt; closed squares- STAMP2-/-.