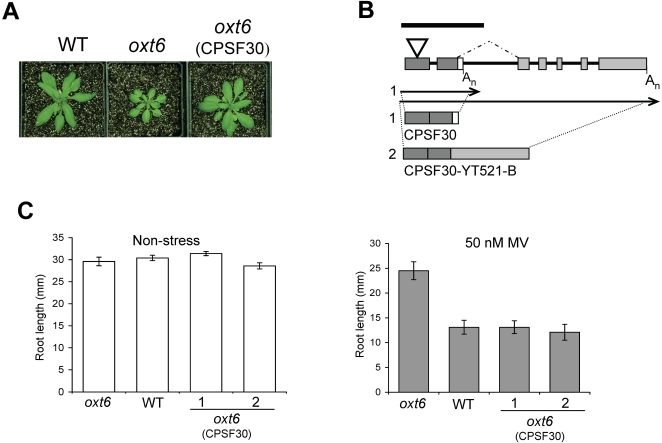
Figure 3. Complementation of the mutant phenotype by the AtCPSF30 coding region.
(A) Photograph of representative plants grown in soil under unstressed conditions. (B) Schematic representation of the OXT6 gene structure. Dark gray boxes indicate the exons present in the smaller of the two transcripts encoded by this gene, while light gray boxes represent additional exons present in the larger of the two OXT6-encoded RNAs. Note that the sequence represented by the small white box is absent in the larger RNA. The structures of the spliced RNAs (“1” and “2”) are depicted beneath the illustration of the genomic DNA. The solid line above the illustration of the genomic DNA indicates the extent of the gene that was expressed for complementation studies (note that the promoter sequences are not shown in the illustration). The polyadenylation site within the second intron that is utilized for production of the shorter transcript is denoted as An, and the splice junctions that define the second intron linked together above the depiction of the genomic DNA. (C) Root lengths of wild-type, oxt6 mutants, and oxt6:AtCPSF30 plants after exposure to 50 nM MV.

