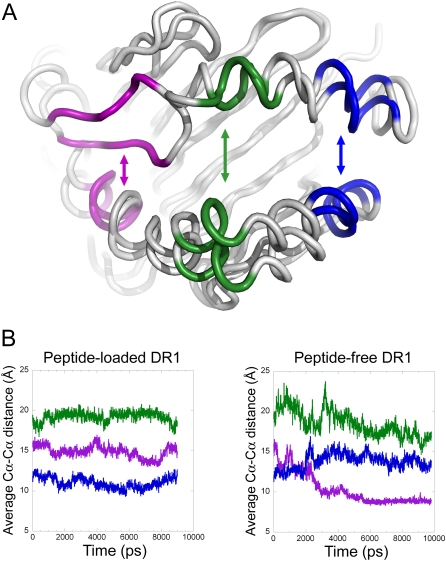
Figure 2. Motion of a50-59 into the peptide binding site during molecular dynamics in the absence of peptide.
(A), Ribbon diagram of peptide-free DR1 before and after molecular dynamics simulations, showing residues at N-terminal end (magenta, α52-57 and β79-83), central region (green, α62-66 and β65-69), or C-terminal end (blue, α71-75 and β58-62) of peptide binding site, used to calculate distances across the binding site (indicated by arrows). (B), Changes during molecular dynamics simulation of distances across the peptide binding site at three different locations, colored as indicated in panel A.

