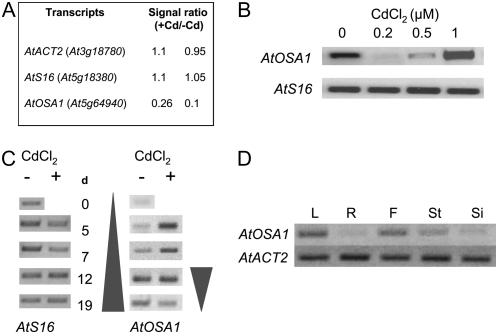
Figure 1.
AtOSA1 gene expression in Arabidopsis. A, Analysis of the transcript levels of AtOSA1 in leaves after exposure to 0.2 μm CdCl2 for 3 weeks under hydroponic growth conditions using cDNA spotted arrays. The data presented show the +Cd to −Cd ratio obtained from spotted array replicates. B, Confirmation of the chip data and cadmium dose-dependent experiment using semiquantitative RT-PCR (35 cycles). C, Time-dependent (days) regulation of AtOSA1 in leaves of Arabidopsis in the presence (+) or absence (−) of 0.5 μm CdCl2. D, RT-PCR analysis of AtOSA1 in plant organs: leaf (L), root (R), flower (F), stem (St), and silique (Si).

