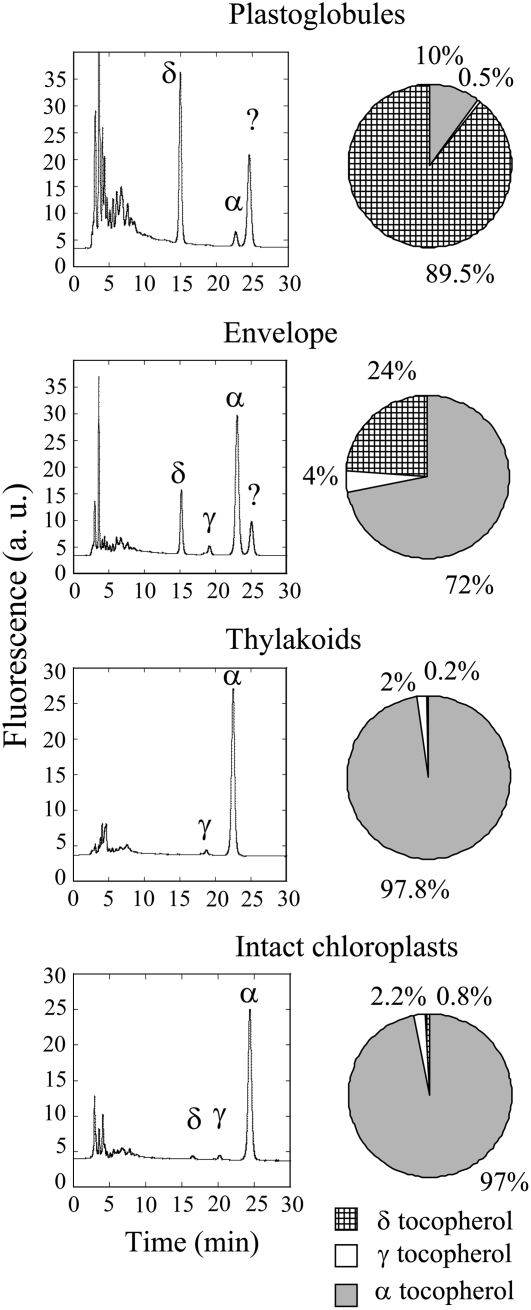
Figure 2.
Chromatograms of vitamin E in the different membrane fractions of wild-type chloroplasts, and vitamin E composition in plastoglobules, thylakoids, envelopes, and intact chloroplasts in wild-type plants. The experiments were repeated three times with similar results. The peak labeled ? corresponds to an unknown compound. α, γ, and δ represent α-, γ-, and δ-tocopherol, respectively. a.u., Arbitrary units.

