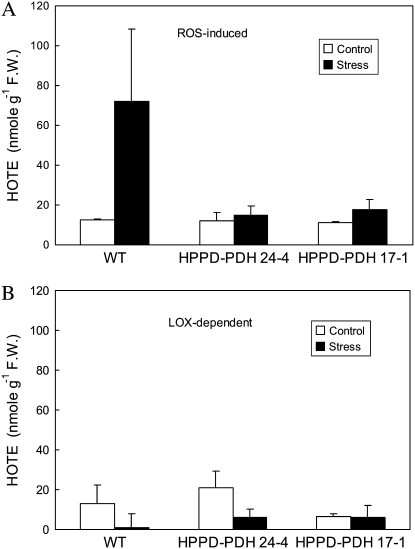
Figure 8.
HPLC measurements of lipid peroxidation in leaves of wild-type and transgenic plants exposed for 4 d to high light at low temperature (10°C, 700 μmol m−2 s−1, 14-h photoperiod). A, Concentrations of lipid hydroperoxides formed by ROS. B, Concentrations of lipid hydroperoxides generated enzymatically by lipoxygenases (LOX). F.W., Fresh weight. Data are mean values of three separate experiments + sd.

