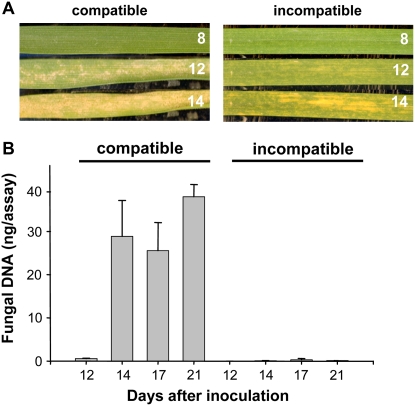
Figure 1.
Visible phenotypes of the compatible and incompatible interactions between wheat and M. graminicola used in this study. A, Left panels show a single attached leaf of the susceptible cultivar Avalon inoculated with M. graminicola isolate IPO323 and photographed after 8, 12, and 14 d. Right panels show a single leaf of the resistant cultivar Cadenza (Stb6) inoculated with IPO323 and photographed after 8, 12, and 14 d. Note that both cultivars show no visible signs of infection until 12 d after inoculation. B, Determination of fungal biomass across the time course of symptom development using a quantitative PCR assay directed toward fungal genomic DNA. These data demonstrate the extreme susceptibility of Avalon and the resistance of Cadenza possessing the specific resistance gene Stb6.

