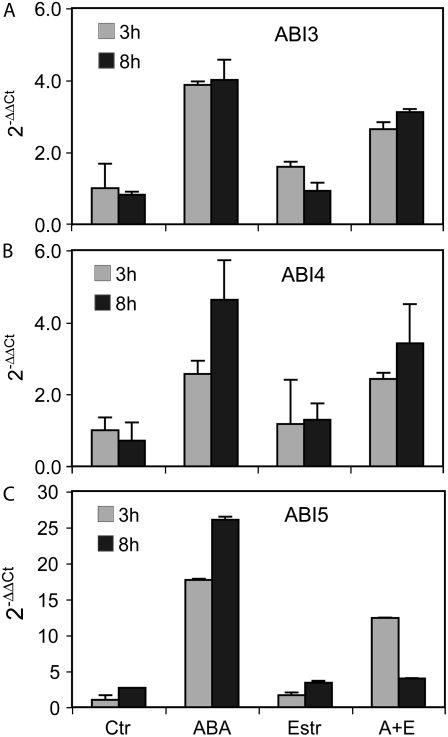
Figure 4.
A to C, Comparison of regulation of ABI3, ABI4, and ABI5 transcript levels in A26 seedlings (A, ABI3; B, ABI4; C, ABI5). Quantitative RT-PCR analysis was performed with RNA templates isolated from 3-d-old A26 seedlings treated with either 20 μm ABA, or 4 μm estradiol, or their combination (A+E) for 3 and 8 h. Ctr, Untreated control. Relative values are shown using GAPDH2 as internal reference.

