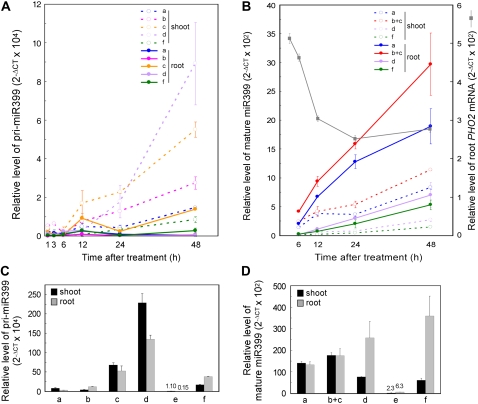
Figure 5.
A and B, Time-course analyses of different pri-miR399s (a, b, c, d, and f; A) and mature miR399 species (a, b+c, d, and f; B) during the initiation of Pi deprivation. The dashed and solid lines indicate the expression levels in shoots and roots, respectively. The level of PHO2 mRNA was included in B as a gray solid line. All miR399 species are shown except miR399e because of its low expression. The level of mature miR399b and c cannot be distinguished because of identical sequences. C and D, Relative expression levels of pri-miR399s (C) and mature miR399s (D) in shoots (black bars) and roots (gray bars) after 5 d of Pi starvation treatment. Please note that the mature miR399a and b/c could have been overestimated in B and D (see Supplemental Fig. S5). One of two biological replicates is presented, and the error bars indicate the sd of two technical replicates.

