Figure 7.
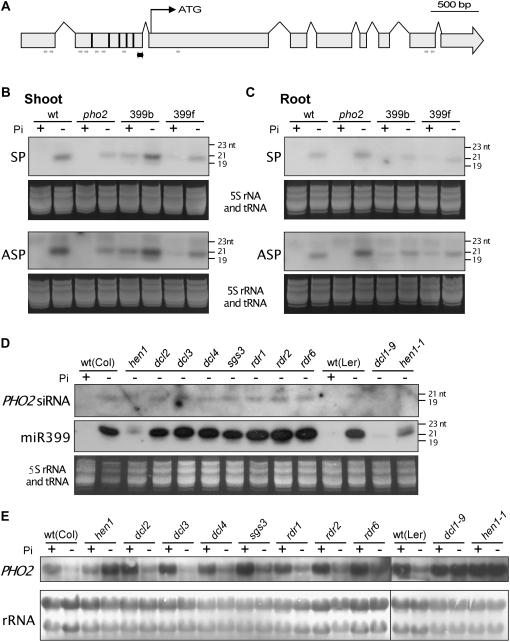
Detection of PHO2 siRNA. The location of probe (double-pointed black arrow) and sequenced small RNAs (single-pointed gray arrows indicating the direction of 5′ to 3′) corresponding to the PHO2 transcript are marked in A. The vertical bars within the second exon indicate the five miR399 target sites. B and C, RNA gel-blot analysis of PHO2 siRNAs in Pi-sufficient (+Pi) and 5-d Pi-starved (−Pi) shoots (B) and roots (C) of wild-type (wt), pho2, and miR399-overexpressing (399b and 399f) plants. The siRNA could be detected by both SP and ASP. D, Detection of PHO2 siRNA (ASP) and miR399 in the roots of small RNA biogenesis mutants subjected to 5-d Pi-starvation treatment. E, RNA gel-blot analysis of PHO2 mRNA in the roots of different mutants under Pi-sufficient or -deficient conditions. Staining of 5S ribosomal RNA and tRNA (B–D) and 25S and 18S ribosomal RNAs (E) is shown as the loading control.

