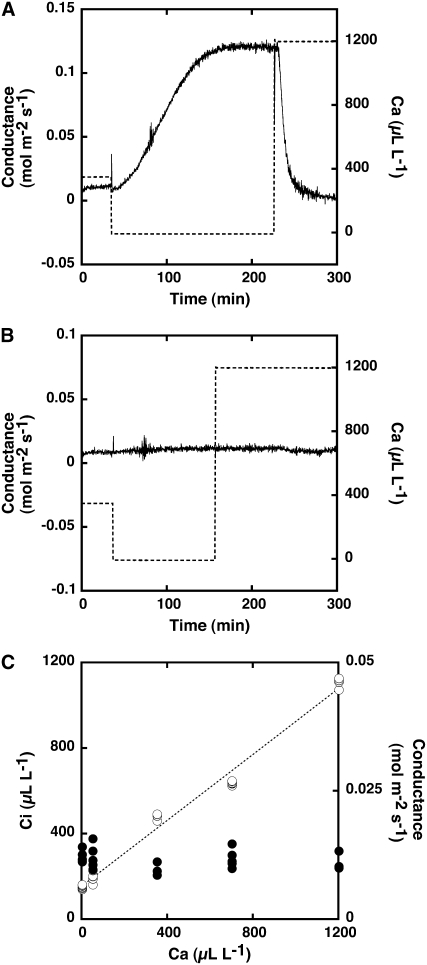
Figure 3.
Stomatal responses to Ca in the dark. A, Stomatal conductance in intact leaves of Arabidopsis. B, Stomatal conductance in intact leaves of A. capillus-veneris. Leaves were held in a leaf chamber for 1 h under darkness at a CO2 concentration of 350 μL L−1 and then exposed to low (0) and high (1,200 μL L−1) concentrations of CO2 by changing the concentration in the chamber. Dotted lines show the CO2 concentration in the chamber. C, Relationship between Ca and Ci (white circles) and stomatal conductance (black circles) in the range of 0 to 1,200 μL L−1 Ca. The dotted line represents the linear relationship between Ca and Ci.

