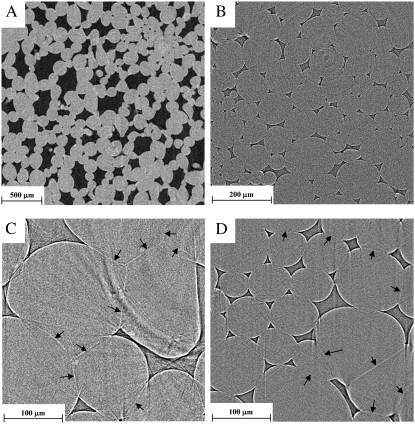
Figure 1.
A to D, Tomographic images of the cortex of apple (A and C) and pear (B and D). Shown are slices (512 × 512 pixels) obtained by absorption tomography (A and B), at 5- and 1.4-μm pixel resolution for apple and pear, respectively, and phase contrast tomography (C and D) at 700-nm pixel size. Dark regions are gas-filled intercellular spaces; light regions are cells. Cell walls (indicated by arrows) between adjacent cells can be distinguished in the phase contrast images and are specifically clear in apple cortex.

