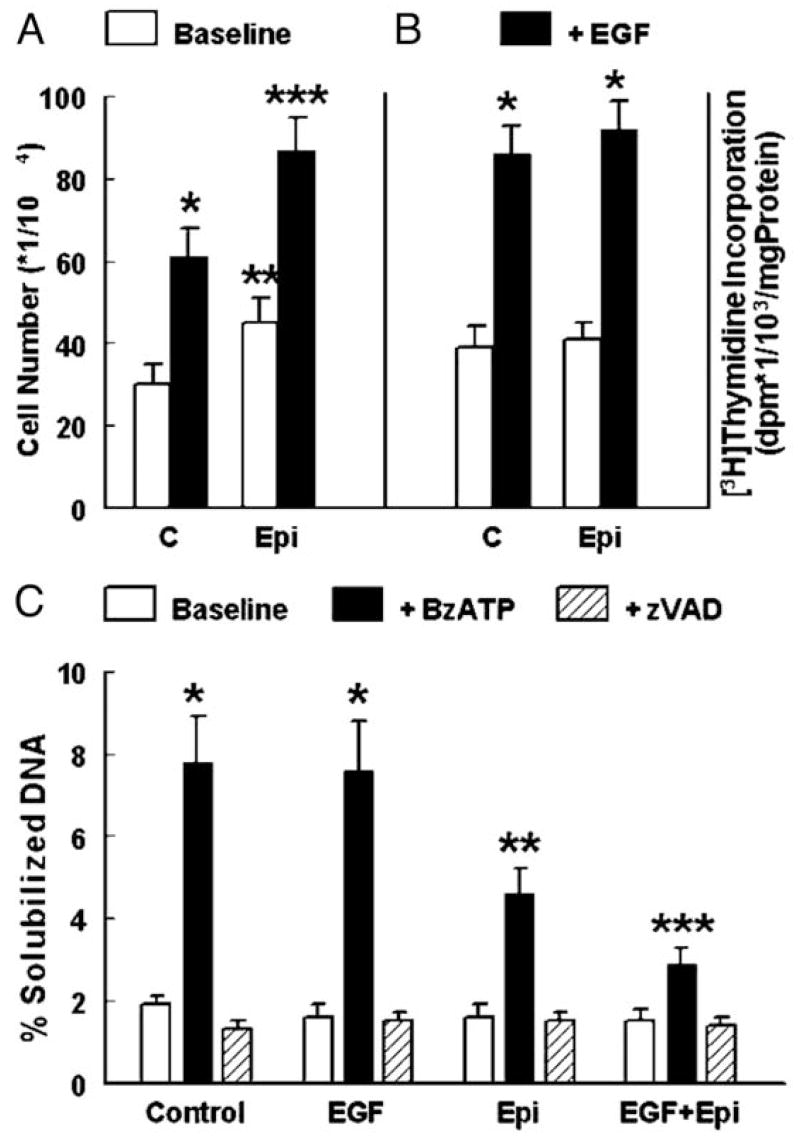
Fig. 1.
Means (± SD, three to five independent experiments) of the effects of EGF and epinephrine (Epi) on number of CaSki cells in culture (panel A), DNA synthesis (panel B), and BzATP-induced DNA solubilization (panel C). In A: *, P < 0.01 (EGF vs. Baseline); **, P < 0.03 [Baseline, Epi vs. C (control)]; ***, P < 0.03 (EGF, Epi vs. C). In B: *, P < 0.01 (EGF vs. Baseline, in both C and Epi groups). In panel C: *, P < 0.01 (BzATP vs. Baseline, Control and EGF groups); **, P < 0.01 (BzATP, Epi vs. Control and EGF groups); ***, P < 0.03 (BzATP, EGF+EPI vs. Epi groups).

