
FIG. 5.
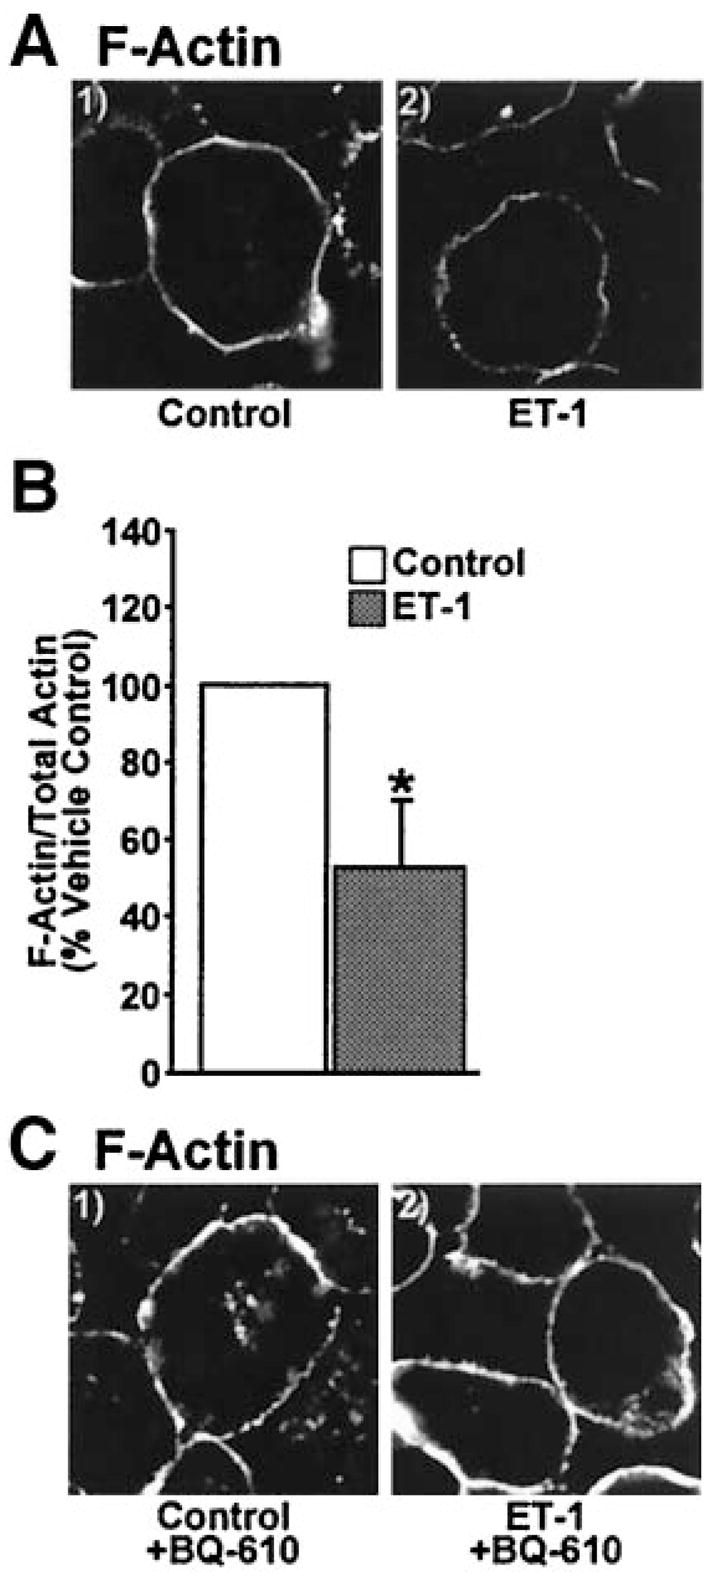
Cortical F-actin is disrupted by ET-1. Images of cells subjected to phalloidin labeling (A and C) or quantification of F- and G-actin fractions (B). Images and means ± SE are from three experiments (*P < 0.05 vs. control).
Official websites use .gov
A
.gov website belongs to an official
government organization in the United States.
Secure .gov websites use HTTPS
A lock (
) or https:// means you've safely
connected to the .gov website. Share sensitive
information only on official, secure websites.
Cortical F-actin is disrupted by ET-1. Images of cells subjected to phalloidin labeling (A and C) or quantification of F- and G-actin fractions (B). Images and means ± SE are from three experiments (*P < 0.05 vs. control).