
Figure 1.
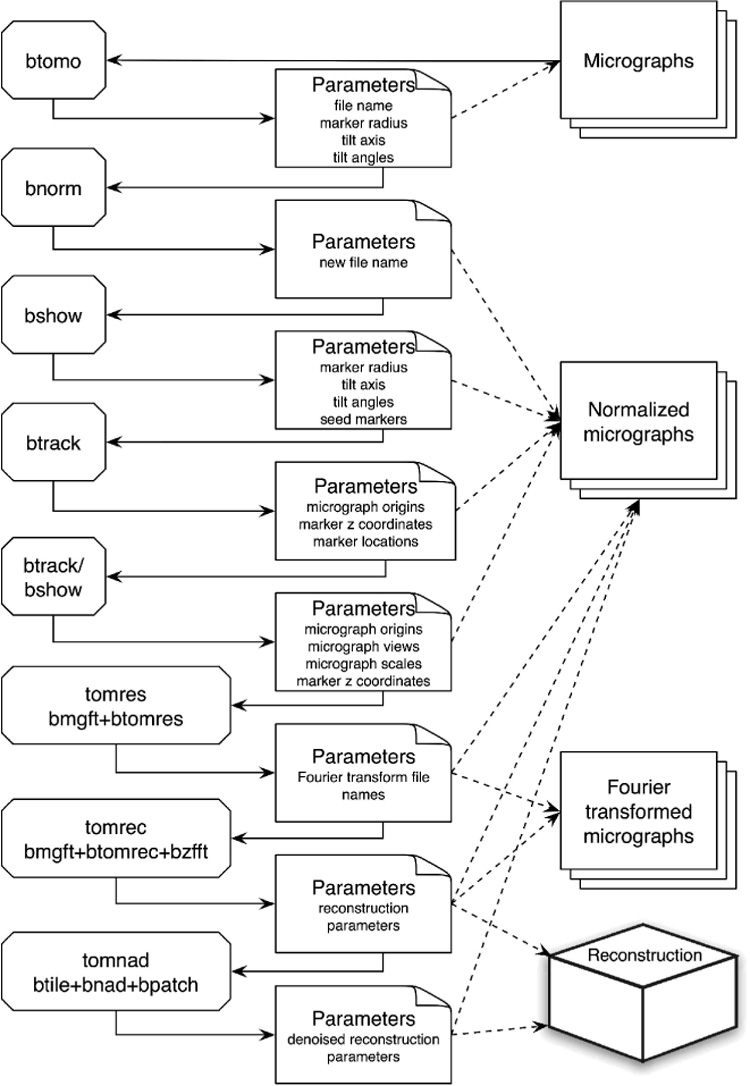
Workflow of tomographic processing in Bsoft, showing the programs on the left, the parameter files in the middle and the actual images on the right. Solid lines indicate direct I/O, while dashed lines indicate references to the image files. In the parameter file boxes, the parameters changed at that stage are listed. The last three boxes on the left refer to scripts that can be run across a distributed processing system.