
Figure 2.
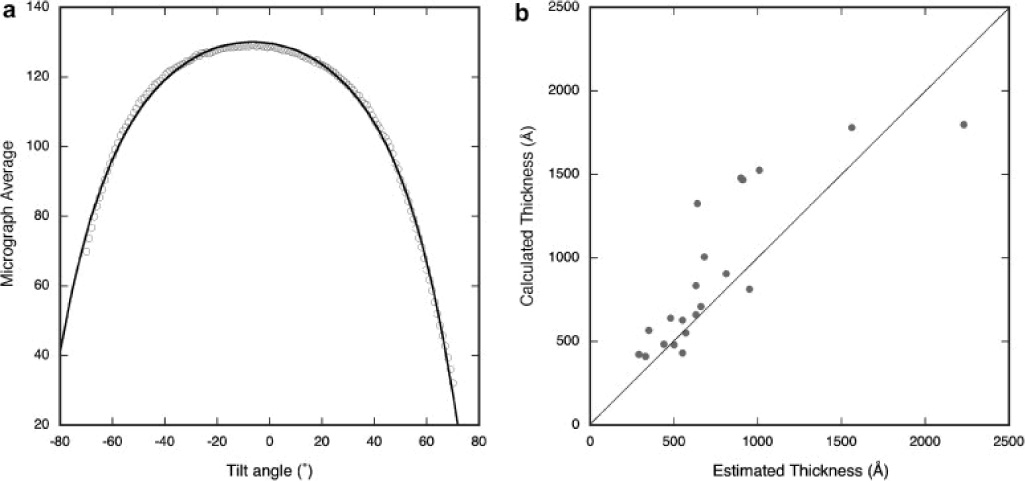
(A) Variation of the micrograph average is a function of the thickness or path length of the electron beam passing through the specimen. The asymmetry of the curve can be partially attributed to the tilt of the specimen volume with respect to the plane perpendicular to the electron beam. The fitted curve corresponds to: where the thickness of the center of the tomogram was estimated at ~ 660 Å by inspection of the reconstructed tomogram. (B) The specimen thickness estimated by inspection of the reconstruction compared to that calculated from the micrograph averages.