
Figure 5.
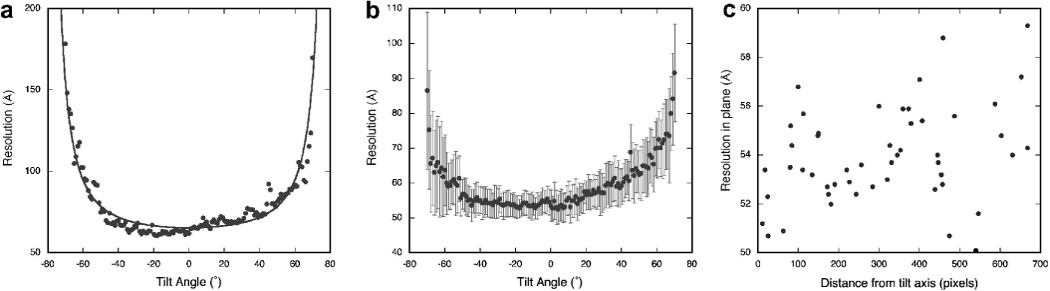
Resolution analysis of a tomogram. (A) Estimation of the resolution of a tilt series with a FRC cutoff of 0.3. The fitted curve gives the relationship to the relative thickness of the specimen at various tilt angles: . (B) Average of the resolutions estimated from each of 50 particles extracted from a tomogram as a function of the tilt angle (FRC cutoff of 0.3). The bars indicate the standard deviation error. (C) Resolution of each particle in the 0° tilt micrograph as a function of the distance from the tilt axis (disregarding the depth of the particle in the tomogram volume).