
Figure 4.
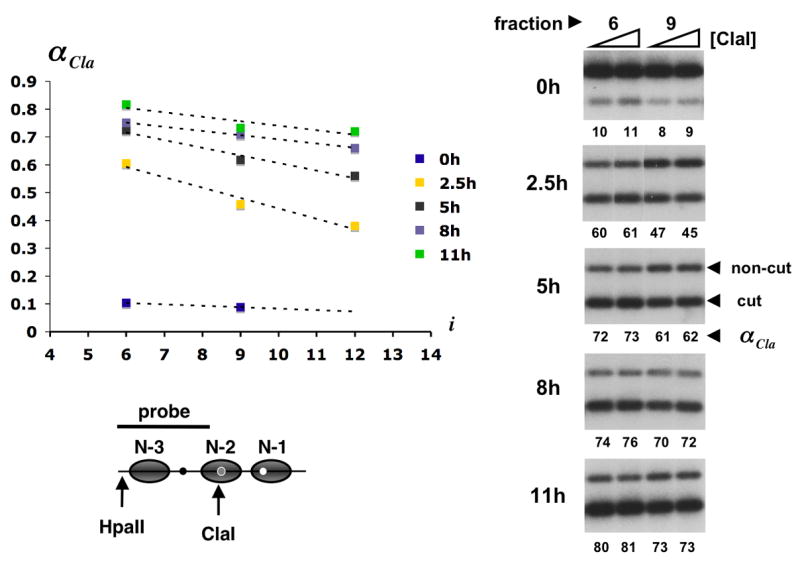
Cla I accessibility across gel filtration profiles from Fig. 1. About 20 attomol of promoter circles from column fractions 6 and 9 (0 h after induction) or fractions 6, 9, and 12 (2.5, 5, 8, and 11 h after induction) were digested in 300 μl with 20 and 60 u of Cla I for 30 min at 37°C. Circle DNA was extracted, digested to completion with Hpa II, separated in a 2% agarose gel, blotted and hybridized with the radioactively labeled DNA probe indicated in the promoter diagram at the bottom of the figure (gray ovals represent nucleosome core particles; black, grey, and white dots represent UASp1, UASp2, and the TATA box, respectively). Primary data for fractions 6 and 9 are shown on the right. The lower and upper bands represent circles cut and not cut by Cla I. The fraction of circles cut, αCla, is indicated as a percentage beneath each lane. The mean of αCla at 20 and 60 u of Cla I was plotted against the column fraction number i = 4,…,14 (upper left). Cla I accessibility gradients were determined by linear regression.