
Figure 5.
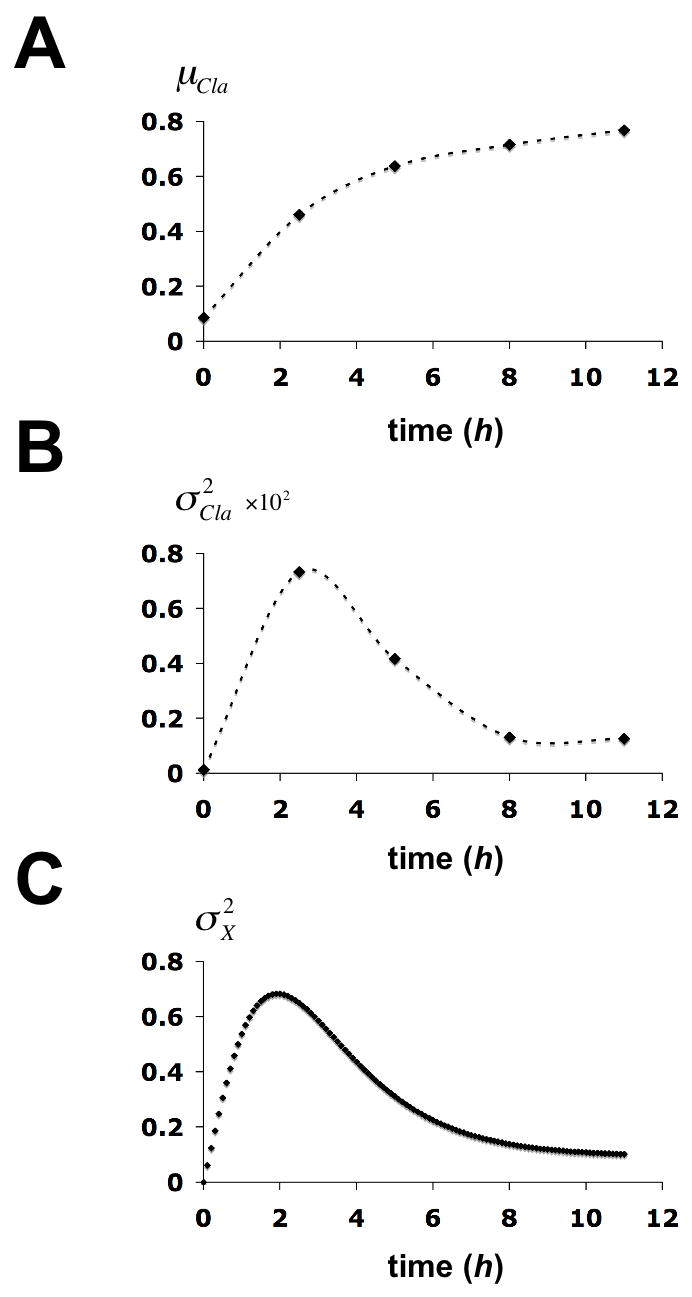
Time evolution of statistical parameters for the chromatin structure transition at the PHO5 promoter. (A) The mean of Cla I accessibility of the gel filtration profile at time t after induction, μα(t), is plotted against the time. (B) The variance of Cla I accessibility of the gel filtration profile at time t, , is plotted against the time. (C) The variance in X at time t, , was calculated from the solution to equation (7) (Methods) and plotted against time. Calculations were based on the chromatin transition topology of Fig. 2B with γj, 0 = 0.2 h−1 for j ∈ {1,2,3}, γj, i = 2 · γj,0 for all (j, i) with i ∈ {1,2,3} and j ∈ {4,5,6},γ0,i = 0.1 · γj,0 for i ∈ {1,2,3},γj,i = 0.2 · γj,0 for all (j, i) with i ∈{4,5,6} and j ∈{1,2,3}, and γj,i = 2 · γj,0 for all sliding transitions.