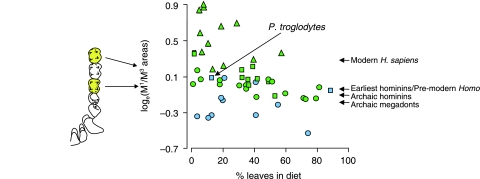
Fig. 4.
The maxillary M1/M3 ratios (the ratio of the areas of the smallest rectangular box that will fit around each tooth in occlusal view) for maxillary molars in anthropoid primate species (triangles = cebids; circles = cercopithecoids; squares = hominoids) plotted against the percentage of leaves plus seeds reported in their diets (after Lucas et al. 1986c). Species shown in blue are mainly terrestrial, while those in green are predominantly arboreal. The lower the value of this ratio, the larger their molar tooth row. Approximate hominin molar ratios are also indicated. From the earliest hominins, overall molar size increased (and thus the M1/M3 ratio decreased), reaching its maximum among the archaic megadonts, overlapping those of terrestrial primates and suggesting heavy abrasive wear. In the genus Homo, molar size decreased. H. sapiens is represented by the San population. Hominin molar areas are calculated from data in van Reenen (1982) (H. sapiens); Wood & Engleman (1988) (P. aethiopicus, P. boisei, H. habilis, H. rudolfensis and H. ergaster); White et al. (1994) (Au. afarensis); Haile-Selassie (2001) (Ar. kadabba); Ward et al. (2001) (Au. anamensis); and Moggi-Cecchi et al. (2006) (Au. africanus and P. robustus).

