
Figure 4. Results from a new visual field location.
After all the experiments shown in Figure 3 had been completed at visual-field Location 1 (Figure 2A), the same series of experiments were repeated at a new stimulus location (Location 2; Figure 2D). All data were collected from a 5×5 mm V1 region in the left hemisphere.
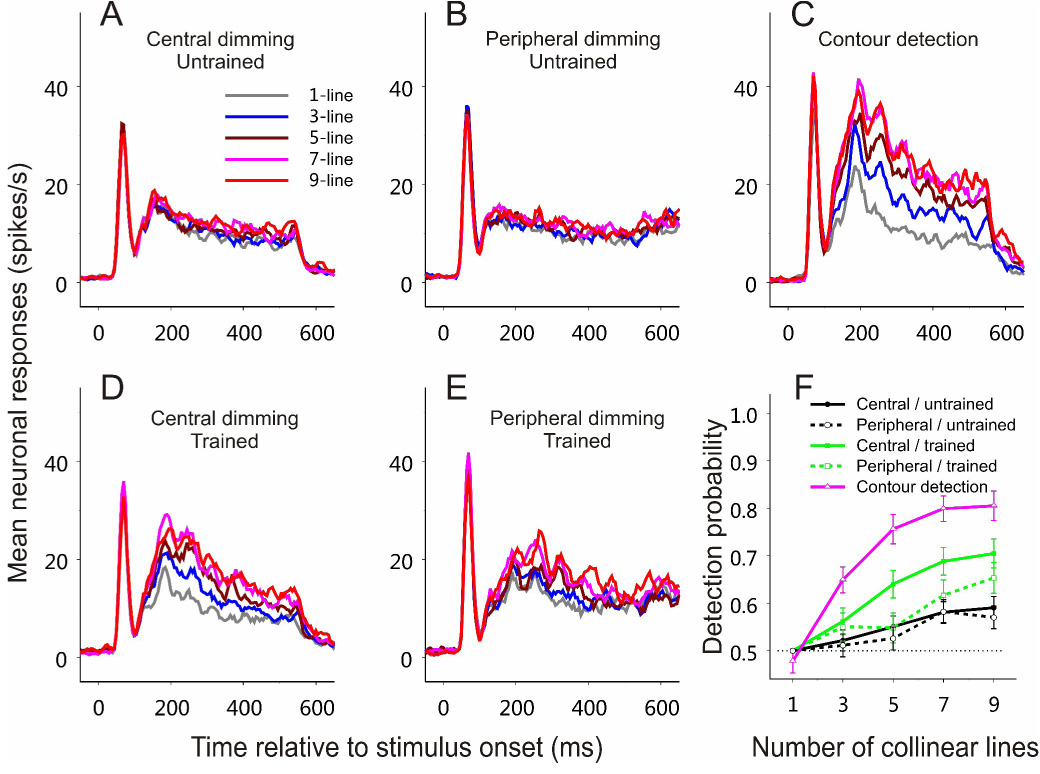
(A–E) PSTHs based on averaged neuronal responses to contours consisting of 1, 3, 5, 7, 9 collinear lines in different experimental stages.
(A) Central-dimming task before training on contour detection. n = 50 (26 and 24 cells, respectively, from the two animals).
(B) Peripheral-dimming task before training on contour detection. n = 47 (24 and 23, respectively, from the two animals).
(C) Contour detection task during the late training phase. n = 28 (16 and 12, respectively, from the two animals).
(D) Central-dimming task after training on contour detection. n = 37 (22 and 15, respectively, from the two animals).
(E) Peripheral-dimming task after training on contour detection. n = 36 (22 and 14, respectively, from the two animals).
(F) Averaged neurometric curves based on ROC analysis of the data shown in (A)–(E), respectively.
Refer to Figure 3 for more details about each panel.