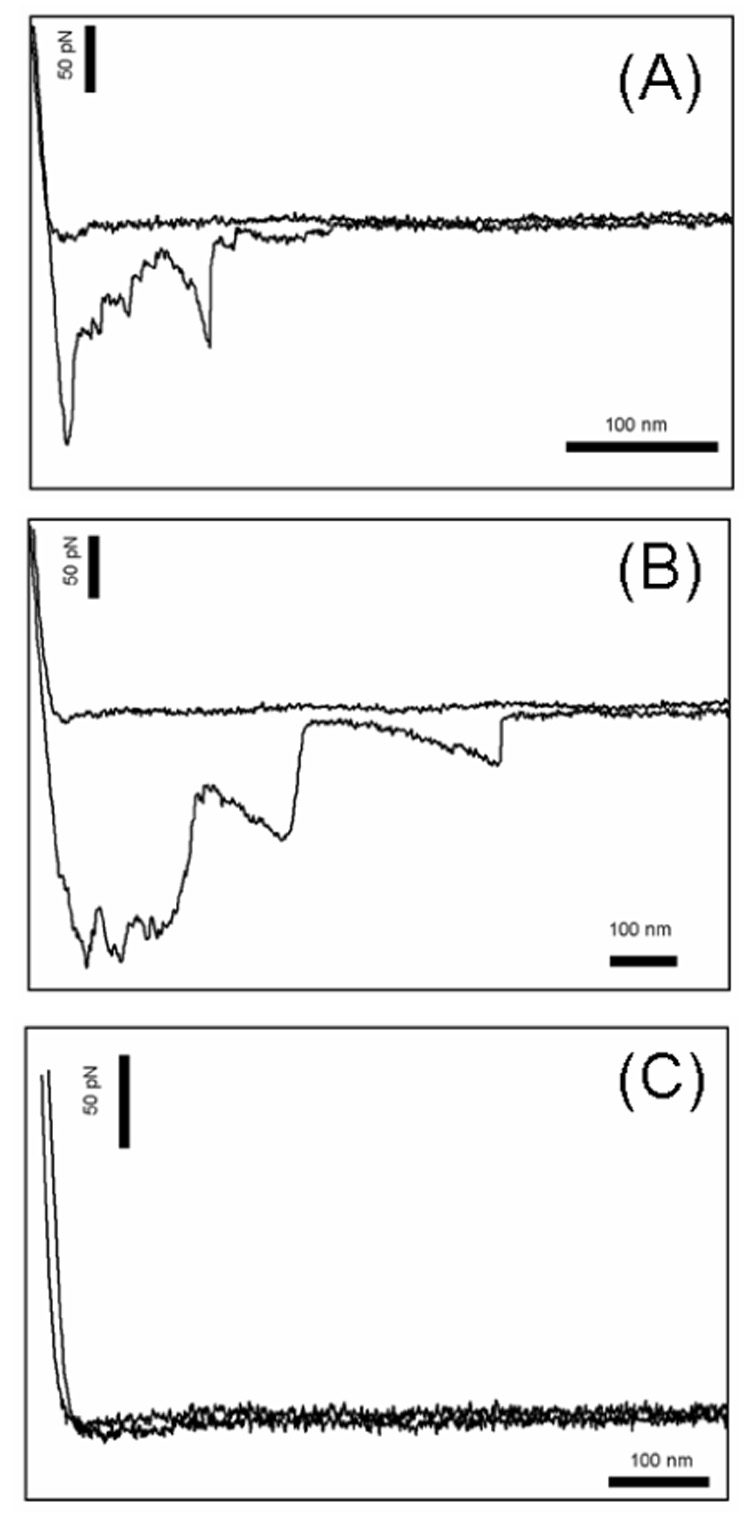
Figure 7.

Typical force distance curves for the force spectroscopy experiments with ScpB and Fn. (A) Fn surface coverage of 8%, (B) Fn surface coverage of 100%, (C) Fn blocked with excess ScpB. Note that horizontal scale bars in the plots are the same distance. The interactions lengths for the higher concentrations is longer.
