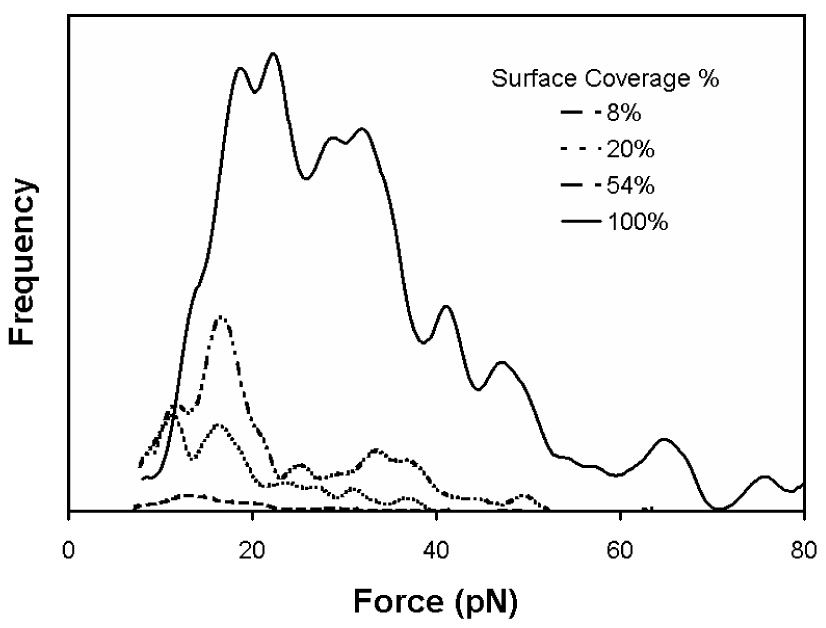
Figure 8.

Force distributions for the Fn/ScpB system as a function of Fn surface coverage. As the surface density of Fn increases, the frequency of an interaction and the rupture force both increase. There is a large jump in the frequency and force from 54 to 100 % Fn coverage, indicating that there is a transition where the binding becomes more favorable. The average rupture forces were 19 pN (8% Fn coverage), 20 pN (20% Fn coverage), 22 pN (54% Fn coverage) and 34 pN (100% Fn coverage), based on calculating the distribution mean. If the peaks in the force distribution are fit to a Gaussian distribution, the first peak is at 14 pN and the second peak is at 29 pN.
