
Figure 2.
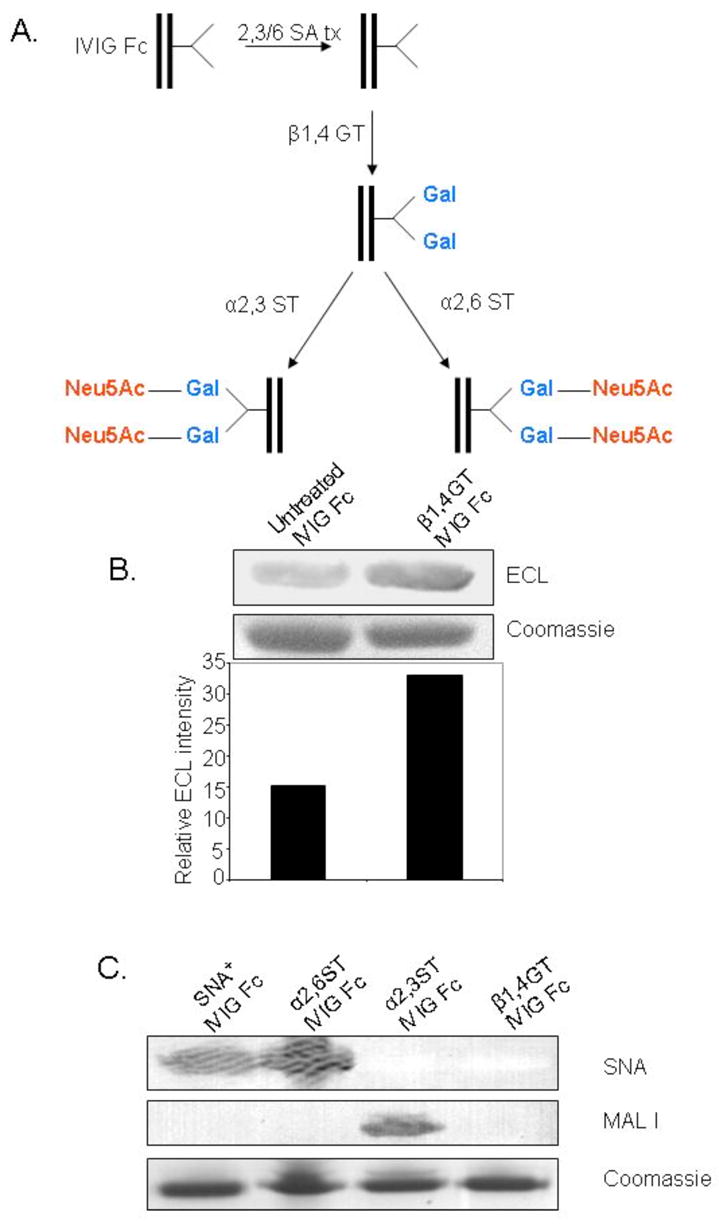
In vitro sialylation of IVIG Fcs. A. As shown in the schematic diagram of the sialylation strategy, IVIG Fc fragments were initially treated with 2,3/6 sialidase (2,3/6 SA) to remove all sialic acid residues, galactosylated (β1,4 GT), and finally sialylated with either 2,3 or 2,6 sialyltransferases (α2,3 ST and α2,6 ST, respectively). B. Galactosylation was verified by lectin blotting with ECL (top panel), which recognizes terminal galactose residues. Relative band intensity ratios of ECL to coomassie loading controls are plotted below. The galactosylated Fcs were then sialylated with 2,3 or 2,6 sialyltransferases, and (C) each sialylation reaction was confirmed by lectin blotting for 2,6 linkages with SNA (top panel) and 2,3 linkages with MAL I (middle panel). Coomassie stained loading controls are show below.