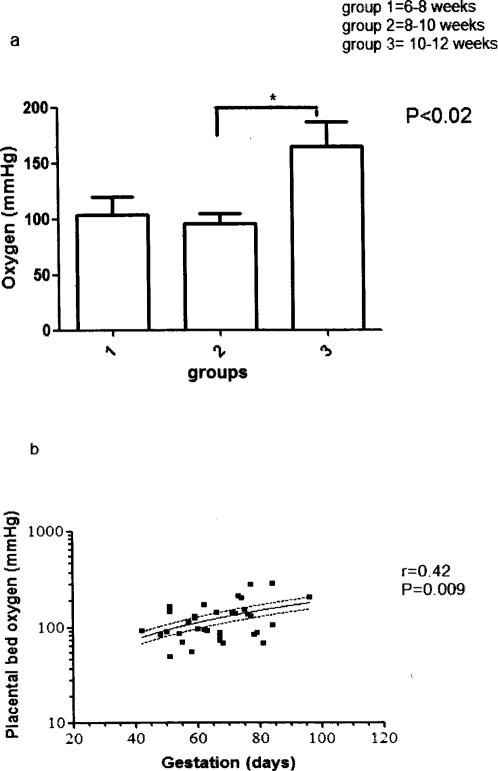
Figure 1.
a: Placental bed oxygen concentration in early pregnancy. Mean±SEM values of placental bed blood concentrations in the different fluids measured. Group 1 = 6–8 weeks, group 2 = 8–10 weeks, group 3 = 10–12 weeks. P = 0.02, ANOVA. b: Relationship between gestation and oxygen concentration in the placental bed. Linear regression curve for PB PaO2 (log) vs gestation in days. 95% confidence interval lines are above and below the regression line. R = regression co-efficient and P = significance level. N = 37.

