
Figure 1. Expansion of Stress BFU-E in the fetal liver of f/f and control mice.
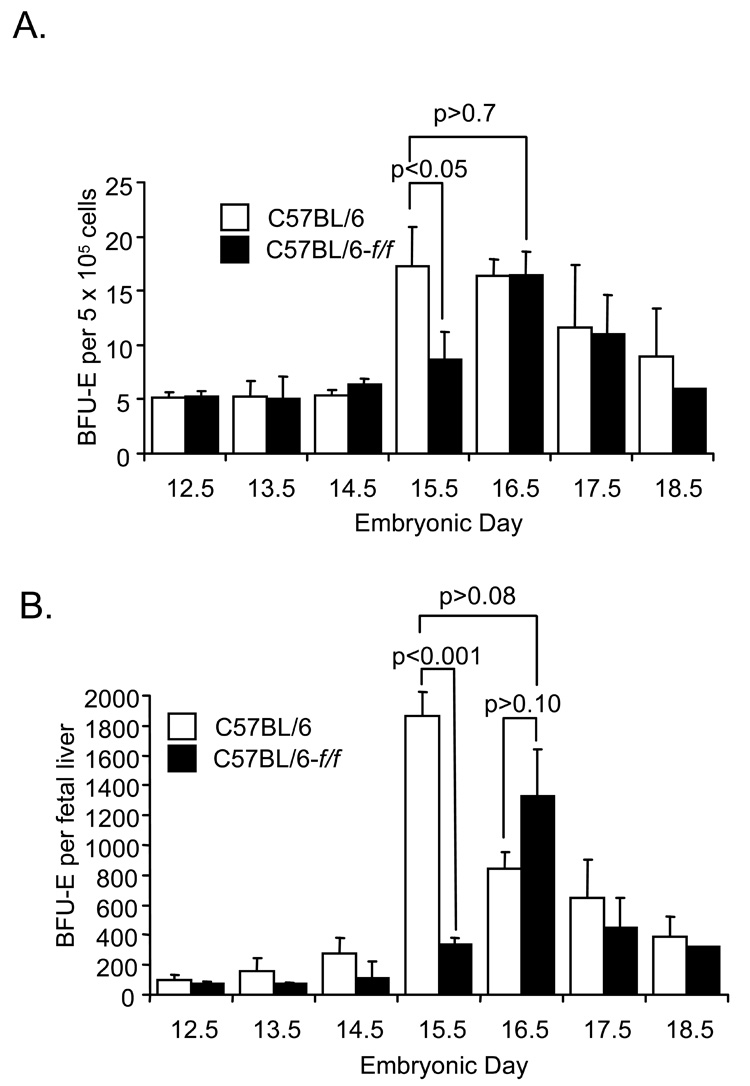
Fetal liver cells were isolated on the indicated days during fetal development and plated in methylcellulose media containing only Epo. BFU-E were scored after five days in culture. (A) Relative number of BFU-E per 5×10⁵ fetal liver cells. (B) Total number of stress BFU-E per fetal liver. The significance of the differences between f/f and control discussed in the text are indicated on the figure. If no other p value is given then the difference was not significant.