
Figure 7. Yolk sac contains stress BFU-E and progenitor cells that develop into stress BFU-E when Yolk sac cells are plated on fetal liver stromal cells.
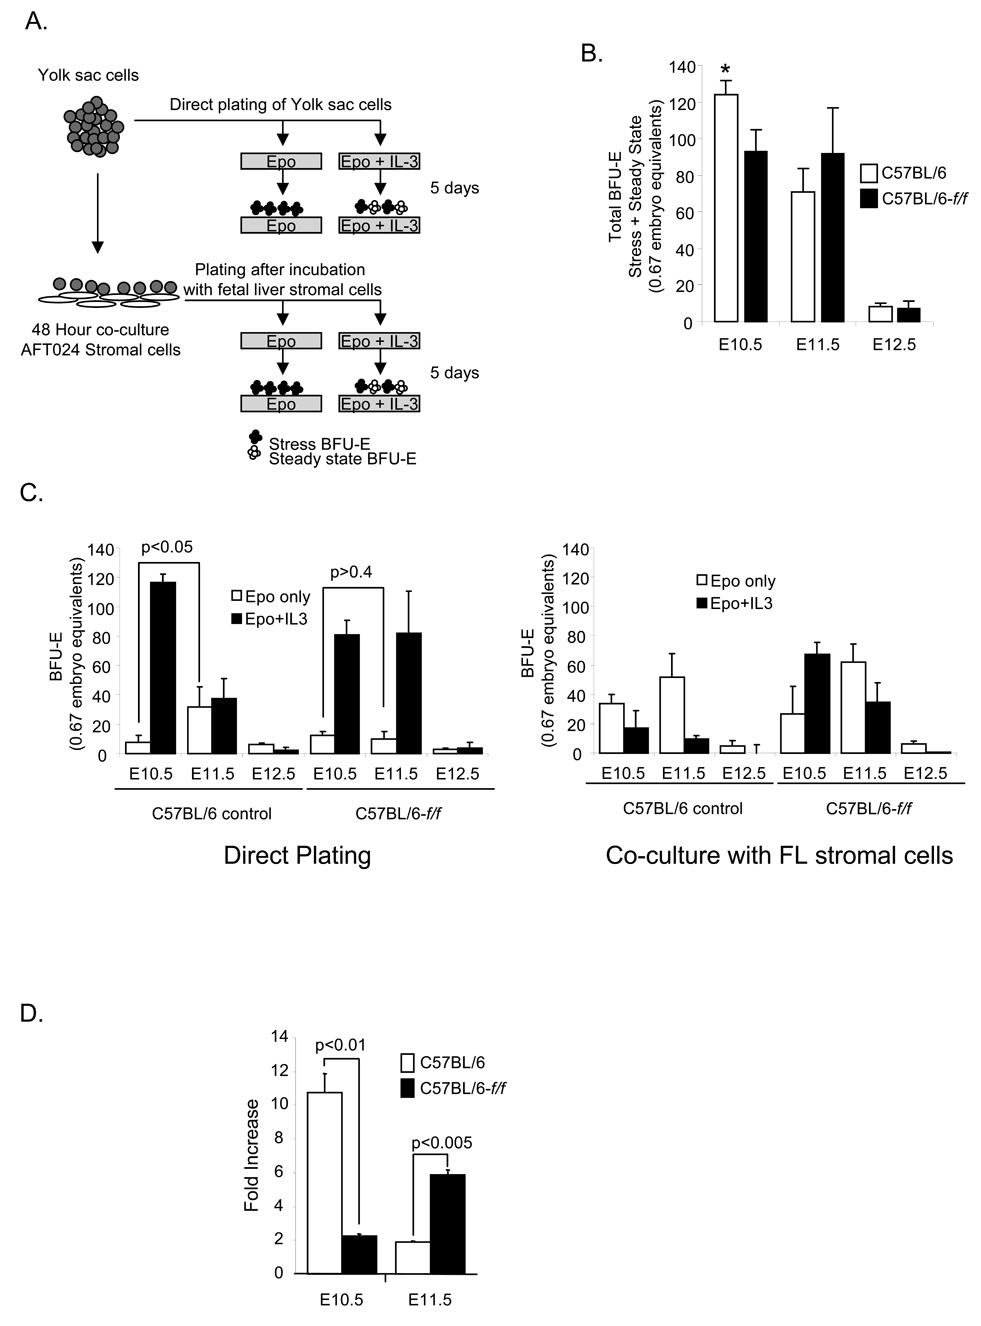
(A) Schematic of the direct plating of yolk sac cells and co-culture with AFT024 cells prior to plating. (B) Total number of BFU-E (stress BFU-E+ Steady State BFU-E) present in the yolk sac of C57BL/6-f/f and C57BL/6 control mice on the indicated days of embryonic development. *p<0.05 when E10.5 control yolk sacs were compared with E10.5 mutant and E11.5 mutant or control yolk sacs. (C) Left panel: Yolk sac cells from E10.5, E11.5 and E12.5 control and f/f embryos were directly plated in media containing Epo alone or Epo+IL-3. BFU-E were scored 5 days later. Right panel: Yolk sac cells from E10.5 and E11.5 control and f/f embryos were co-cultured on AFT024 fetal liver stromal cells for 48 hours and then plated in methylcellulose media containing Epo alone or Epo+IL-3. BFU-E were scored 5 days later. Epo + IL-3 BFU-E were calculated by subtracting the number of Epo-only BFU-E from the total number of BFU-E formed in Epo+IL-3. The significance of the differences between different time points in f/f and control yolk sacs as discussed in the text are indicated on the figure. If no other p value is given then the difference was not significant. (D) The fold increase in stress BFU-E observed when E10.5 and E11.5 yolk sac cells were co-cultured AFT024 cells.