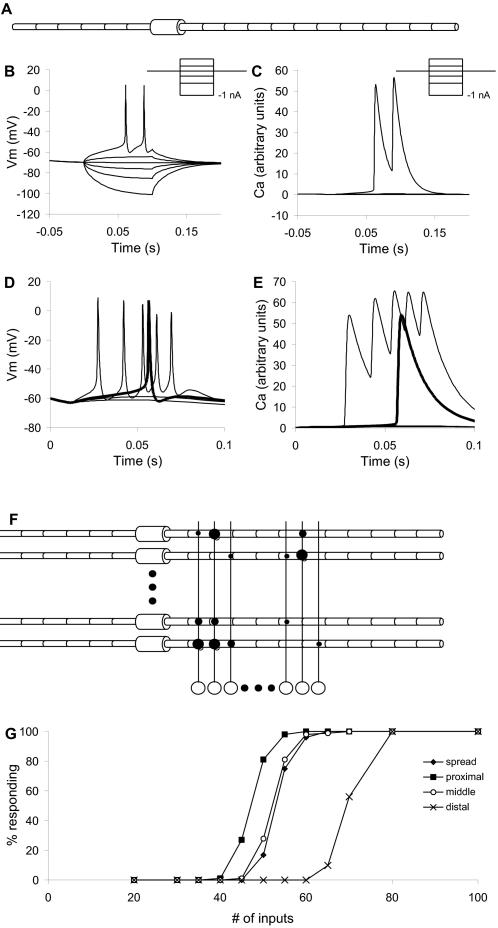
Figure 1. Basic Model.
(A) Compartmental structure of CA1 neuronal model. The model had 19 compartments, including 12 apical dendritic compartments and one soma. (B) Somatic intracellular potential responses of compartmental model to current injection pulses from −1 nA to +0.5 nA (inset). (C) Ca2+ responses to same current series. (D) Somatic intracellular potential responses to synaptic input on 40, 50, 60 and 100 identical synapses, delivered at t = 10 ms. Input to 60 synapses elicited one action potential, plotted in bold. (E) Corresponding Ca2+ responses. (F) Schematic of network model structure. There were 100 CA1 neuronal models and 10000 single-compartment input neuron models. The different synaptic strengths are indicated with different sized circles. Note that the connection probability was 5%, so the actual connectivity was much sparser than shown. (G) Responses of a population of simulated neurons to different numbers of inputs distributed over the neuron. The synaptic weights were modeled as a Gaussian distribution as described in the Methods. The ‘spread’ input case had about 50% responses for 50 inputs.

