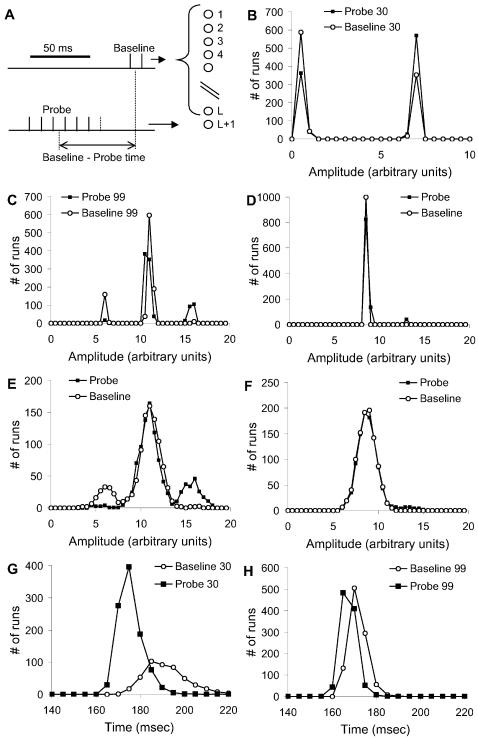
Figure 3. Refining the Stimulus Protocol.
(A) Stimulus protocol. L axons were stimulated for the baseline stimulus, using two pulses. The L+1 axon was used for the probe stimulus, consisting of N pulses at varying times before the baseline stimulus. The reference condition used L = 1300, N = 6 and probe-baseline = 30 ms. (B, C) Distributions of Ca2+ response amplitudes for neurons 30 and 99 respectively. The responses were clumped into a few bins, corresponding to the number of action potentials elicited by the stimulus. (D) Distribution for neuron 99 without baseline stimulus stochasticity, but with probe stimulus stochasticity. A small number of baseline+probe runs had a second action potential. (E) Same responses as (C) with 20% gaussian instrumentation noise. The side peaks were still clearly visible and the probe+baseline distribution was easily separated from baseline. (F) Same responses as (D) with 20% instrumentation noise. The side peak was almost obscured and the two distributions were hard to separate. (G, H) Distributions of Ca2+ response timing for neurons 30 and 99 respectively. There was a 10 ms peak difference for neuron 30, and a 5 ms difference for neuron 99.

