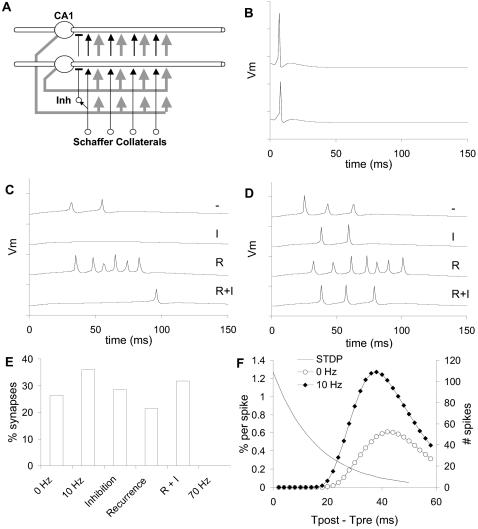
Figure 7. Generalization of Method.
(A) Schematic of generalized circuit including feedforward inhibitory interneurons (Inh), connected to proximal dendrites of CA1 neurons; and recurrent connections from CA1 axons back to the 6 most proximal apical dendrite compartments (gray arrows). Inhibitory interneurons received inputs from ∼120 Schaffer Collateral axons, and synapsed onto ∼5 CA1 neurons. CA1 recurrent projections had a probability of ∼60% of connecting onto any one of the CA1 neurons. (B) Two example inhibitory interneuron responses. There was little variability. (C, D) Two example CA1 pyramidal neuron responses to four circuit cases. Dash: Neither recurrence nor inhibition. I: Inhibition alone. R: Recurrence alone. I+R: Both inhibition and recurrence. All the voltage traces are sampled at 1 ms so the peaks are slightly sub-sampled. (E) Synapse resolution fractions for different circuit cases. These were measured from a subset of 1000 axons out of the 10,000 in the circuit. 0 Hz: Original circuit without background activity. 10 Hz: Original circuit with 10 Hz background activation. In the Inhibition, Recurrence and R+I cases the background was fixed at 10 Hz. 70 Hz: Original circuit with 70 Hz activation leading to 1–3 Hz spiking in the CA1 neurons. No synapses were resolved in this last case. (F) STDP curves and distribution of spike timings. The smooth STDP curve has τ = 15.9 ms and A = 76% for 60 pulses, based on the fits from [28]–[30]. There was little overlap.

