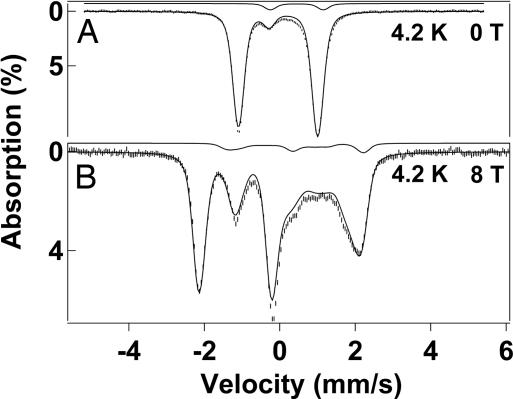
Fig. 3.
Shown are the 4.2 K Mössbauer spectra of 2b in acetonitrile, recorded in zero field (A) and a parallel applied field of 8.0 T (B). The solid lines are the sums of spectral simulations for the diamagnetic FeIVFeIV complex 2b (86%) and an 8% FeIIIFeIII contaminant. For the simulations of 2b we used ΔEQ = +2.09 mm·s−1, η = 0, and δ = −0.04 mm·s−1. Simulated spectra of the diiron(III) contaminant, drawn to scale, are shown above the data. An 8.0 T spectrum taken at 100 K with simulations for various J values is shown in supporting information (SI) Fig. 6.

