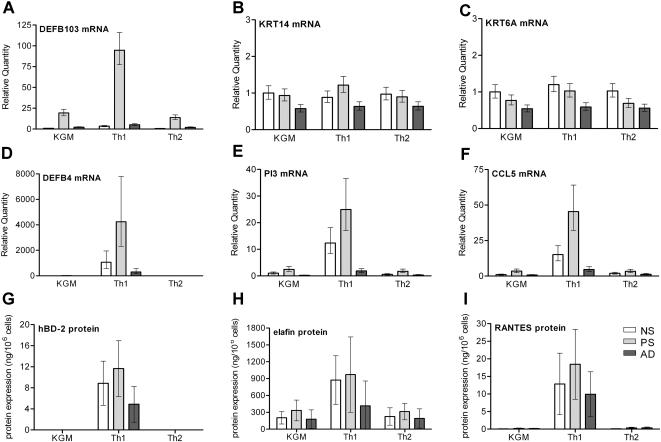
Figure 4. Graphical representation of mRNA and protein expression of selected genes.
qPCR data of DEFB103, KRT14 and KRT6 (A–C); no significant effect of stimulus or diagnosis was found for expression of the cytokeratins KRT14 and KRT6, whereas the antimicrobial peptide DEFB103 (hBD-3) showed a significant effect both for stimulus and diagnosis. Statistical analysis was performed by ANOVA and post-hoc testing by Duncan's multiple range test, see Figure 3 for p-values, see Table S2 for raw data. qPCR data (D–F) and secreted protein levels (G–I) in the culture supernatant; the host defense genes DEFB4 (hBD-2) and PI3 (elafin), and the chemokine CCL5 (RANTES) show similar patterns of expression at the mRNA and protein level. A significant effect of stimulus and diagnosis was found by ANOVA and post-hoc testing by Duncan's multiple range test; see Figure 3 (qPCR) and Table S5 (protein assays) for p-values. qPCR data (A–F) are given in mean and standard error of seven cultures, protein data (G–I) in mean and standard deviation of seven cultures.

