
Figure 4.
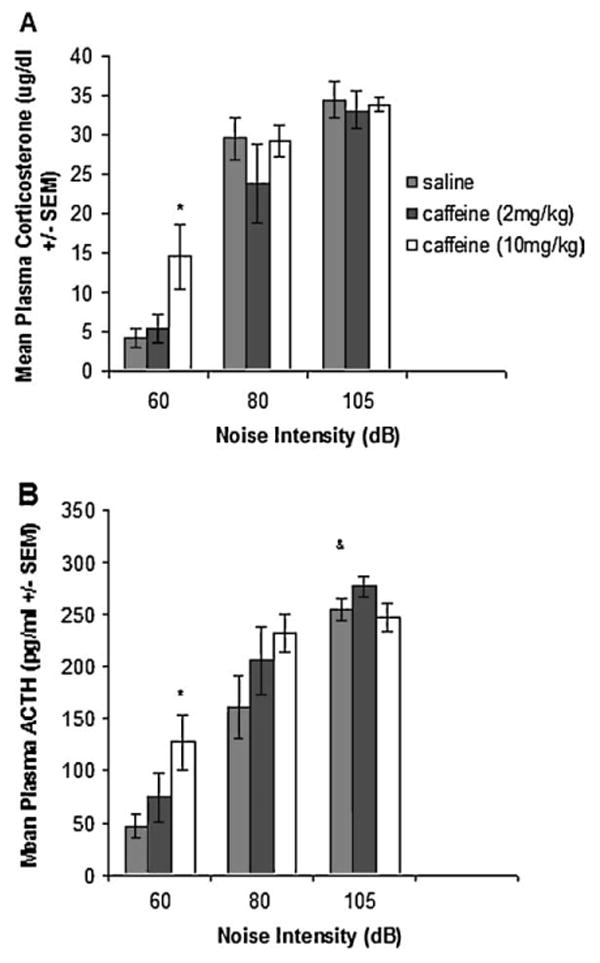
Different groups of rats either received no noise (60 dB background condition) or were exposed to 30 min of different intensities (80 and 105 dB) of loud white noise 30 min after receiving a 2 or 10 mg/kg caffeine injection. A, Mean plasma corticosterone levels (μg/dl±SEM). B, Mean plasma ACTH levels (pg/ml±SEM). Asterisks indicate significant differences between saline vs caffeine-injected groups exposed to the same noise intensity. (&) Indicates significant differences between saline injected rats at 80 vs 105 dB (p<.05).