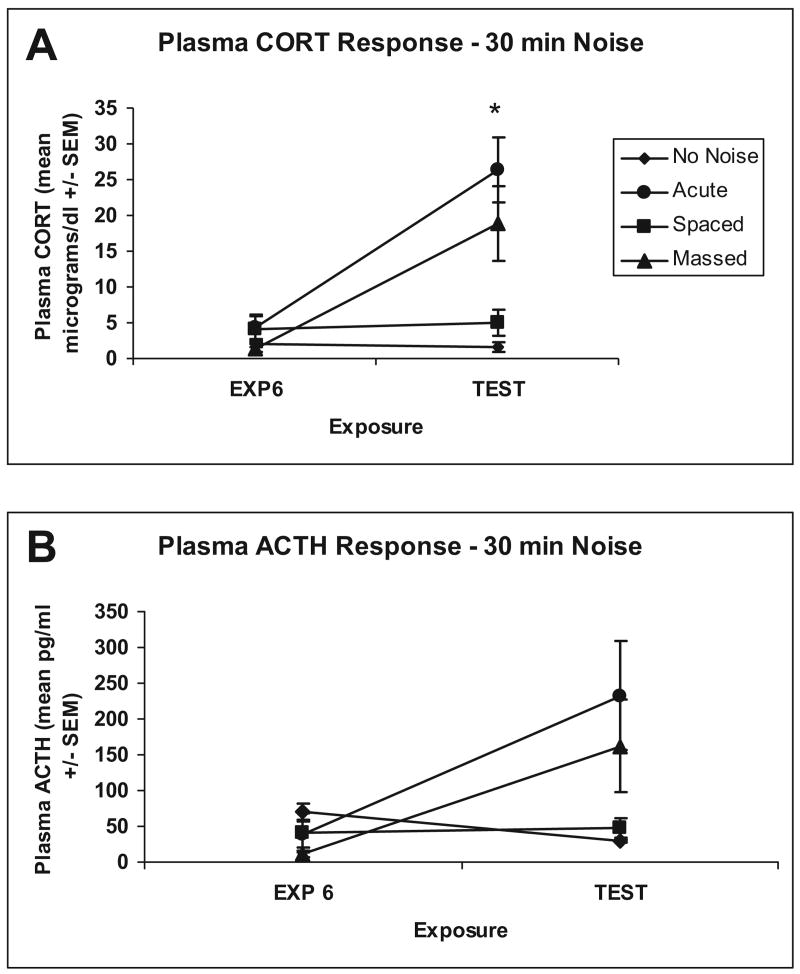
Figure 1.
Graphs show mean (± SEM) plasma levels of corticosterone (CORT; Panel A) and ACTH (Panel B) for no-noise (n = 4), acute (n = 4), spaced (n = 4), and massed (n = 4) groups after sixth exposure to 30 min of 95 dBA noise (space and massed) or no-noise (acute and no-noise) groups; EXP 6. Graph also shows mean (± SEM) plasma levels of CORT (Panel A) and ACTH (Panel B) for no-noise (n = 8), acute (n = 8), spaced (n = 8), and massed (n = 8) groups after 30 min 95 dBA noise test; TEST. *Significant difference between massed and spaced groups (p < .05).

