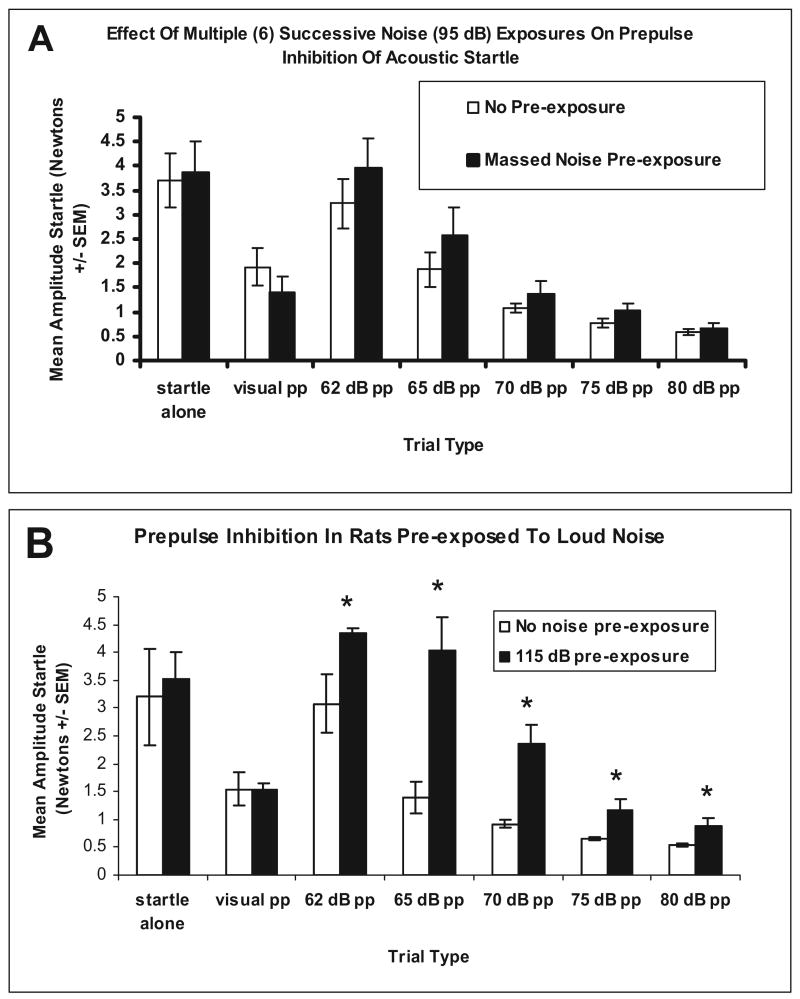
Figure 3.
Graphs show prepulse inhibition results of Experiment 3. Panel A depicts prepulse inhibition results after six massed exposures to 30 min of 95 dBA noise (n = 8) or no preexposure to noise (n = 8). No statistically significant group differences were found. Panel B depicts prepulse inhibition results after 40 min of 115 dBA noise (n = 4) or no preexposure to noise (n = 4). *Significant differences between groups (Tukey HSD; p < .05). pp = prepulse.

