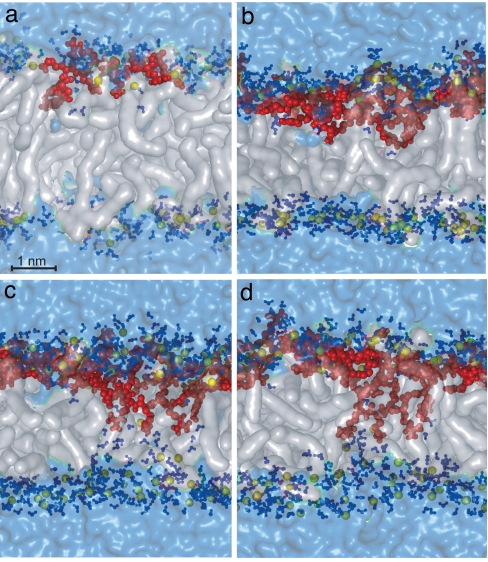
Fig. 2.
Binding and translocation of Tat peptides (simulations A and D in Table 1). (a) Snapshot of the system comprising 72 DOPC lipids, 3,552 water molecules, and one Tat peptide after a 200-ns simulation. The phospholipid molecules are represented with transparent white surfaces, the phosphate atoms are in yellow spheres, the peptide molecules are in red, any water molecule at a distance of <3.5 Å from any phospholipid or amino acid atom is deep blue, and the rest of the water molecules appear as a pale blue transparent surface. (b–d) Snapshots of the system with four Tat peptides and the same number of DOPC lipids and water molecules as in a after 70, 140, and 200 ns, respectively.

