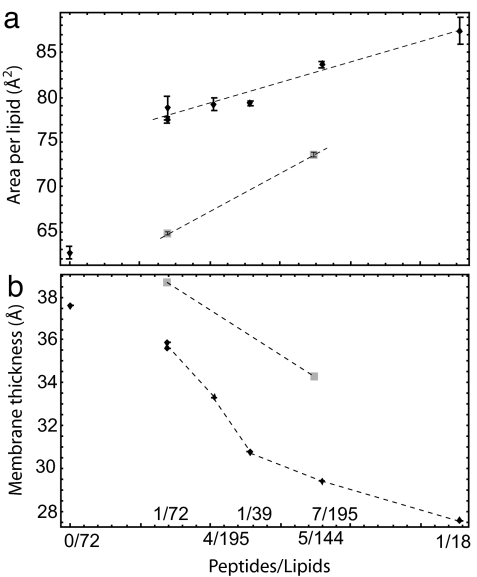
Fig. 4.
Area per lipid and thickness of the bilayer as a function of the number of peptides over the number of phospholipids (simulations A–D and H–L in Table 1). (a) Area per lipid. (b) Thickness of the lipid bilayer. Diamonds indicate results for the cases in which all of the Tat peptides are on the proximal layer. Squares indicate cases in which one Tat peptide is bound to the distal layer and all other peptides are on the proximal layer.

