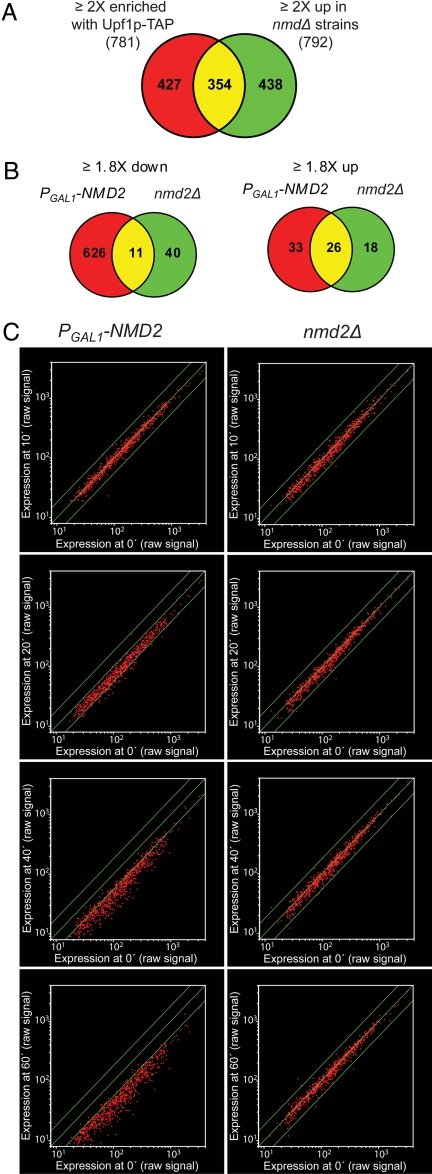
Fig. 1.
Transcripts enriched with Upf1p-TAP or down-regulated upon NMD reactivation. (A) Venn diagram showing the overlap of the 781 probe sets representing the transcripts ≥2-fold enriched with Upf1p-TAP and the 792 probe sets that increased ≥2-fold in nmdΔ strains (3). (B) Venn diagrams showing the overlap of the probe sets that exhibited ≥1.8-fold increases or ≥1.8-fold decreases in the PGAL1–NMD2 and nmd2Δ strains during the time-course experiment. (C) Scatter plots of the 626 probe sets uniquely down-regulated in the PGAL1–NMD2 strain upon shift to galactose-containing medium. The average raw signals at 10, 20, 40, and 60 min in the PGAL1–NMD2 (Left) or the nmd2Δ (Right) strain were compared on a logarithmic scale to the average signal at time point 0. The middle lines indicate the line of equivalence. The outer lines indicate a 1.8-fold difference in expression.

