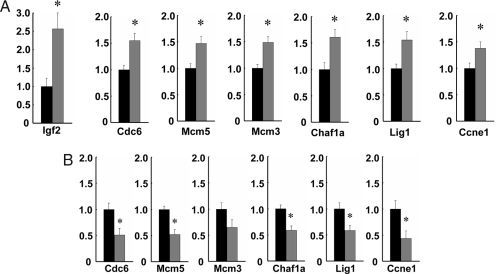
Fig. 1.
Gene expression levels in microdissected intestinal crypts. Quantitative real-time PCR was performed on laser capture microdissected intestinal crypts from 12 LOI(+) and 9 LOI(−) mice. Expression was normalized to β-actin, and the expression level in LOI(+) samples (gray) relative to LOI(−) samples (black) is shown. The bars indicate standard error. (A) Among up-regulated genes in the top ranking GO-annotation categories (DNA replication/cell cycle genes listed in SI Table 3), six genes were validated, and all of the genes showed a statistically significant difference in LOI(+) compared with LOI(−) crypts: Cdc6, 1.55-fold (P = 0.003); Mcm5, 1.47-fold (P = 0.007); Mcm3, 1.49-fold (P = 0.002); Chaf1a, 1.61-fold (P = 0.009); Lig1, 1.54-fold (P = 0.008); and Ccne1, 1.38-fold (P = 0.04). In addition, Igf2 was up-regulated 2.54-fold (P = 0.002) in LOI(+) LCM-dissected crypts. (B) Receptor inhibition by NVP-AEW541 had a differential effect on proliferation-related gene expression in LOI(+) crypts. Analysis was by quantitative real-time PCR of laser capture microdissected intestinal crypts from four LOI(+) and four LOI(−) mice treated with NVP-AEW541 for 3 weeks. Reduction in gene expression in microdissected crypts of LOI(+) mice (gray bars) relative to LOI(−) mice (black bars, normalized to 1.0): Cdc6, 0.49-fold (P = 0.048); Mcm5, 0.48-fold (P = 0.007); Mcm3, 0.65-fold (P = 0.1); Chaf1a, 0.42-fold (P = 0.010); Lig1, 0.42-fold (P = 0.029); and Ccne1, 0.57-fold (P = 0.030). Asterisks indicate significant difference between LOI(+) and LOI(−).

