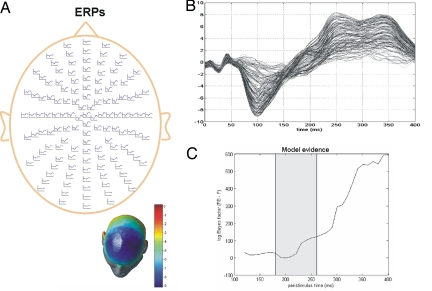
Fig. 2.
Bayesian model comparison among DCMs of grand mean ERPs. (A) Grand mean ERP responses, i.e., averaged over all subjects, to the deviant tone overlaid on a whole-scalp map of 128 EEG electrodes. (B) Overlapped ERP responses to deviant tones from all 128 sensors over the peristimulus interval [0, 400] (in milliseconds). (C) Differences in negative free-energy or log-evidence comparing the model with backward connections (FB) against the model without (F). The gray patch indicates the interval chosen to model the ERPs for each individual subject (see Fig. 3).

