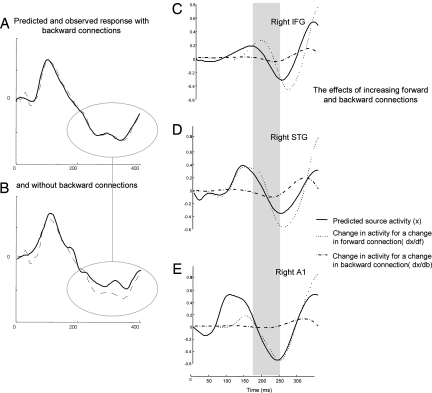
Fig. 4.
Contribution of extrinsic coupling to source activity. The graphs show predicted (solid) and observed (broken) responses in measurement space for the first spatial mode, which was obtained after projection of the scalp data onto eight spatial modes, for (A) FB model and (B) F model. The first mode accounts for the greatest amount of observed variance. The improvement of model fit due to backward connections for later components is evident. Predicted responses at each source (solid line) and changes in activity with respect to a unit change in forward (dotted line) and backward connection (dash-dotted line) for (C) right IFG, (D) right STG, and (E) right A1. The gray bar covers the same period of peristimulus time as in Fig. 2.

