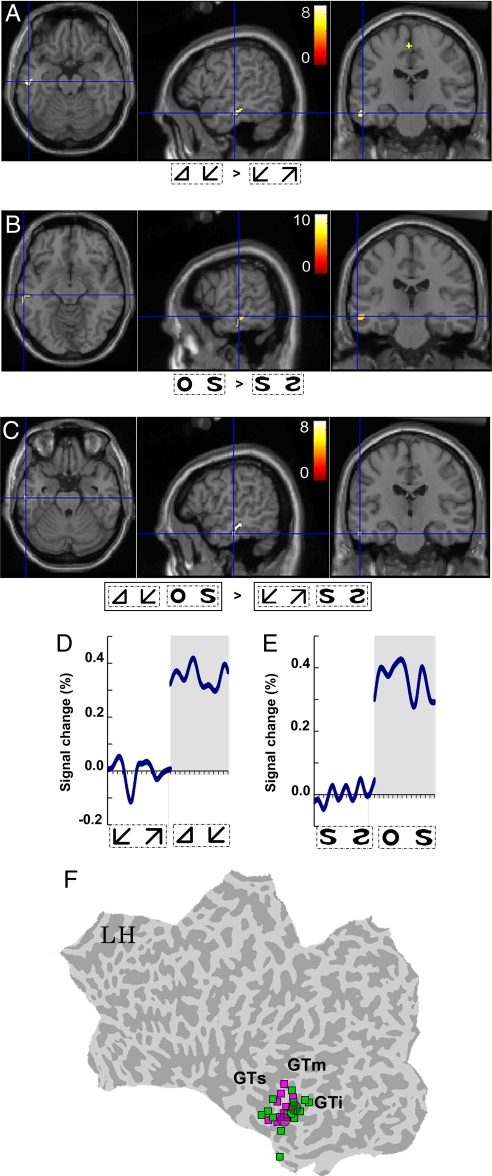
Fig. 2.
Results of the fMRI study. (A–C) fMRI activation loci in conditions A and B and the condition of topological category vs. local geometric category, respectively. (D and E) The two time courses of fMRI signal changes in conditions A and B [t(1,13) = 9.88, P = 3 × 10⁻⁷, and t(1,11) = 4.69, P = 6.6 × 10⁻⁴]. (F) Significant peaks of activation loci identified in 15 individual subjects (green squares) and in a group analysis (larger green circle) in condition A, and in 12 individual subjects (magenta squares) and in a group analysis (larger magenta circle) in condition B; peaks are projected on the IT area of a flattened LH cortical surface of an average template brain.

