
Figure 3.
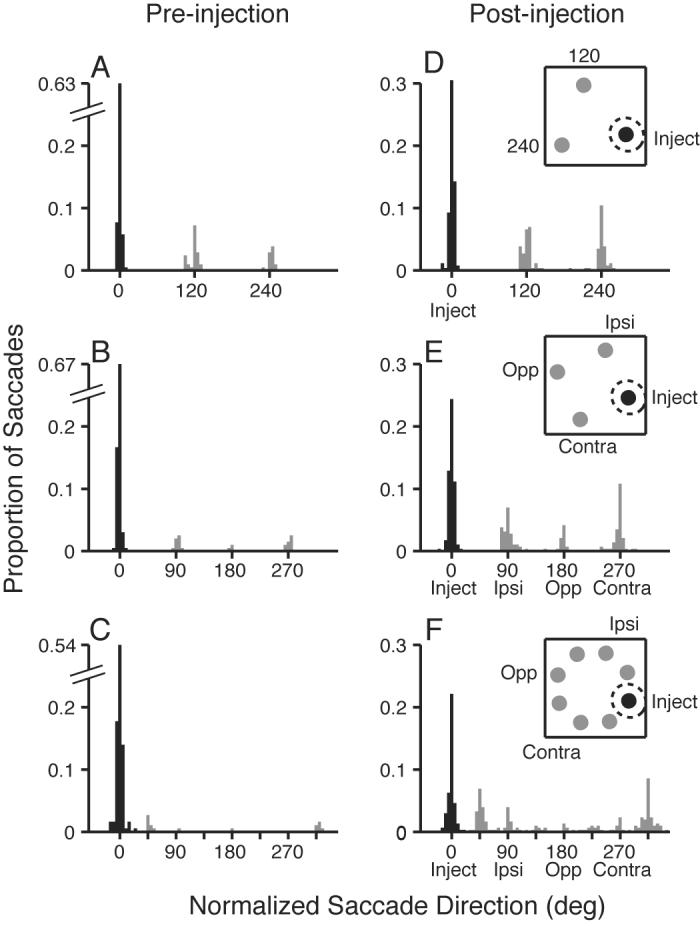
Histograms of saccade endpoint direction for the different distractor conditions before (A-C) and during (D-F) SC inactivation, when the target was presented at the center of the inactivated field. Black bars show correct saccades to the target; gray bars show error saccades. A, D show endpoints in the 2 distractor condition before and during inactivation, respectively. B, E show endpoints in the 3 distractor condition. C, F show endpoints in the seven distractor condition. Data are pooled across 11 lidocaine inactivation sites. Inset cartoons show stimulus conditions, and dashed circle indicates estimated center of the inactivated region.